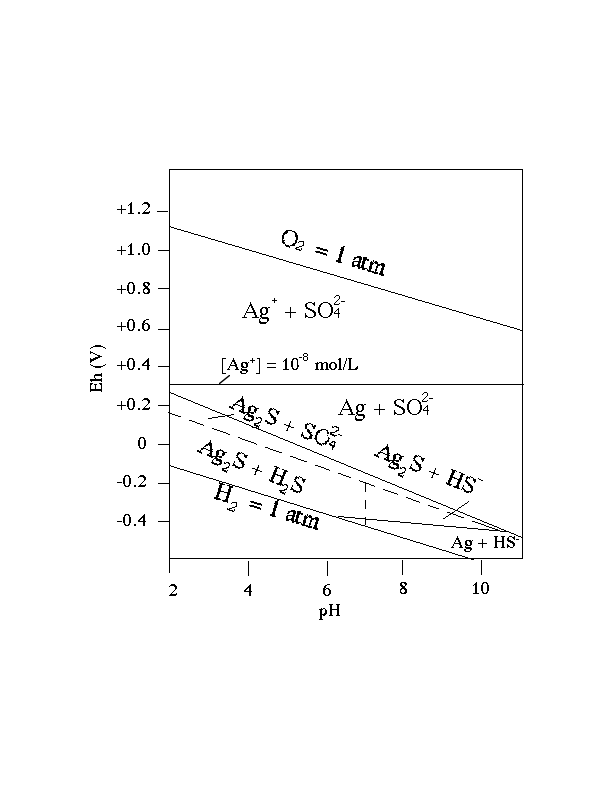
A hot springs system at higher temperature and different concentrations of sulfur and Ag would look different!
The dominant speci
es are indicated for each area. The dotted lines represent the lines of
equla concentration for S species,
and the solid lines for Ag species
