Flood Frequency Analysis and
Determination of 100-year and 500-year Floods
Bernhardt Saini-Eidukat
Department of Geosciences
North Dakota State University

Woodlawn Park region of Moorhead,
April 9, 1997.
(B. Saini-Eidukat, NDSU Geosciences)
Leopold (1994)1 describes a
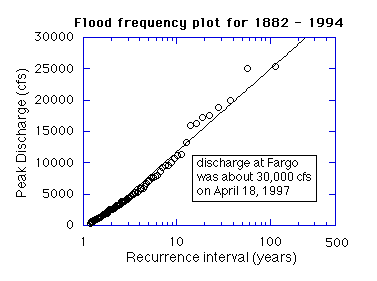
flood frequency curve (see below) as the relation of the size distribution of flood occurrences at a given location on a river to the frequency of these occurrences. To determine the size of a flood occurrence, either the highest annual discharge can be tabulated to form an annual flood series, or all discharge levels above an established limit can be tabulated without regard to annual occurrence. In either case, the data series represents only a sample of the discharge events at the given location, and the observed size distribution may not represent the largest or smallest peak discharge events possible.
For this example, let's use the annual flood series method. To estimate probability that any discharge will be equaled or exceeded in any given year, the peak discharges are ranked from m = 1 (largest), m = 2 (second largest) and so on to m=n, where n is the number of years in the data record. For each data point, a Recurrence Interval (RI) is calculated using the Weibull equation
RI = (n+1)/m
which is the average time interval between the occurrence of two discharge events of a given or greater size (Lundgren, 1986, p. 240)2.
The RI is the reciprocal of the probability of an occurrence.
As an example, in the flood record of the Red River of the North at Fargo, North Dakota, the 11th highest discharge was 11,200 cubic feet per second on April 3, 1994 during the 112 year record (1882 - 1994) in the National Water Data Storage and Retrieval System (WATSTORE) database for North Dakota. The Recurrence Interval of this discharge level is 113/11 or about 10 years, and the probability of a flood discharge of this size occurring in any one year is 1/10, or about ten percent.
The 100-year flood level is that gage height that corresponds to the discharge at RI = 100, which has a probability of being met or exceeded of 1%. Similarly, the 500-year flood level is that gage height corresponding to the discharge extrapolated at RI = 500, which has a probability of being met or exceeded of 0.2 %.

To determine the flood plain that will be inundated by a 100- or a 500-year flood, compare the topography of the area adjacent to the river to the predicted gage height.
How do you translate from discharge to gage height, or vice versa?
The USGS has tables of discharge vs. gage height for each gaging station. For example, if you scroll to near the bottom of the gage for Fargo, you'll see a table that shows discharge vs.gage height.
Below is part of that table.
GAGE HT (ft.)  DISCHARGE (CFS)
   14.0       263
   15.0       899
   16.0      1850
   17.0      2730
   18.0      3460
   19.0      4060
   20.0      4640
   21.0      5220
   22.0      5780
   23.0      6340
   24.0      6950
   25.0      7590
   26.0      8260
   27.0      9060
   28.0      9900
   29.0     10800
   30.0     11900
   31.0     13200
   32.0     14700
   33.0     16500
   34.0     18300
   35.0     20500
   36.0     22900
   37.0     25400
   38.0     28100
   39.0     31000
   40.0     34000
   41.0     37100
   42.0     40500
   43.0     44000

[ Home Page ]
1Leopold, Luna B., 1994, A View of the River: Cambridge, Massachusetts, Harvard University Press, 298 p.
2Lundgren, L., 1986, Environmental Geology: Prentice-Hall, Upper Saddle River, New Jersey, 576 p.


