Dickinson REC 2023 Annual Report
((Research Report, Dickinson REC, December 2023))
NDSU Research and Extension Staff Involved with the Dickinson Research Extension Center
Current Staff - 2023
Chris Augustin Director/Soil Scientist
Ryan Buetow Cropping Systems Specialist
Cristin Heidecker Administrative Secretary
Doug Landblom Associate Research Extension Center Specialist
Llewellyn Manske Scientist of Rangeland Research
Glenn Martin Research Specialist
Dean Nelson Ag Research Technician
Phyllis Okland Administrative Assistant
Samuel Olorunkoya Ag Research Tech
Garry Ottmar Livestock Research Specialist
Wanda Ottmar Research Technician
Robert Paluck Ag Research Technician
Sheri Schneider Information Processing Specialist
Michael Strode Computer Technician
Lee Tisor Research Specialist
2023 Seasonal/Temporary Employees
| John Urban | Michele Stoltz | Chuck Wanner | Tom Grey |
| Taylor Downing | Anastasia Kempenich | Jenna Novotny | Mariah McLaughlin |
| ChristiAnna Schmidt | Adele Speelmon | Gage Kunze | Keaton Meek |
NDSU Dickinson Research Extension Center 1041 State Avenue
Dickinson, ND 58601
Phone: (701) 456-1100
Fax. (701) 456-1199
Website: https://www.ndsu.edu/agriculture/ag-hub/research-extension-centers-recs/dickinson-rec Email: NDSU.Dickinson.REC@ndsu.edu
NDSU is a equal oppurtunity institute.
NDSU does not discriminate in its programs and activities on the basis of age, color, gender expression/identity, genetic information, marital status, national origin, participation in lawful off-campus activity, physical or mental disability, pregnancy, public assistance status, race, religion, sex, sexual orientation, spousal relationship to current employee, or veteran status, as applicable. Direct inquiries to Vice Provost for Title IX/ADA Coordinator, Old Main 201, NDSU Main Campus, 701-231-7708, ndsu.eoaa@ndsu.edu. This publication will be made available in alternative formats for people with disabilities upon request, 701-231-7881.
Table of Contents | |
| 2023 Variety Trials | |
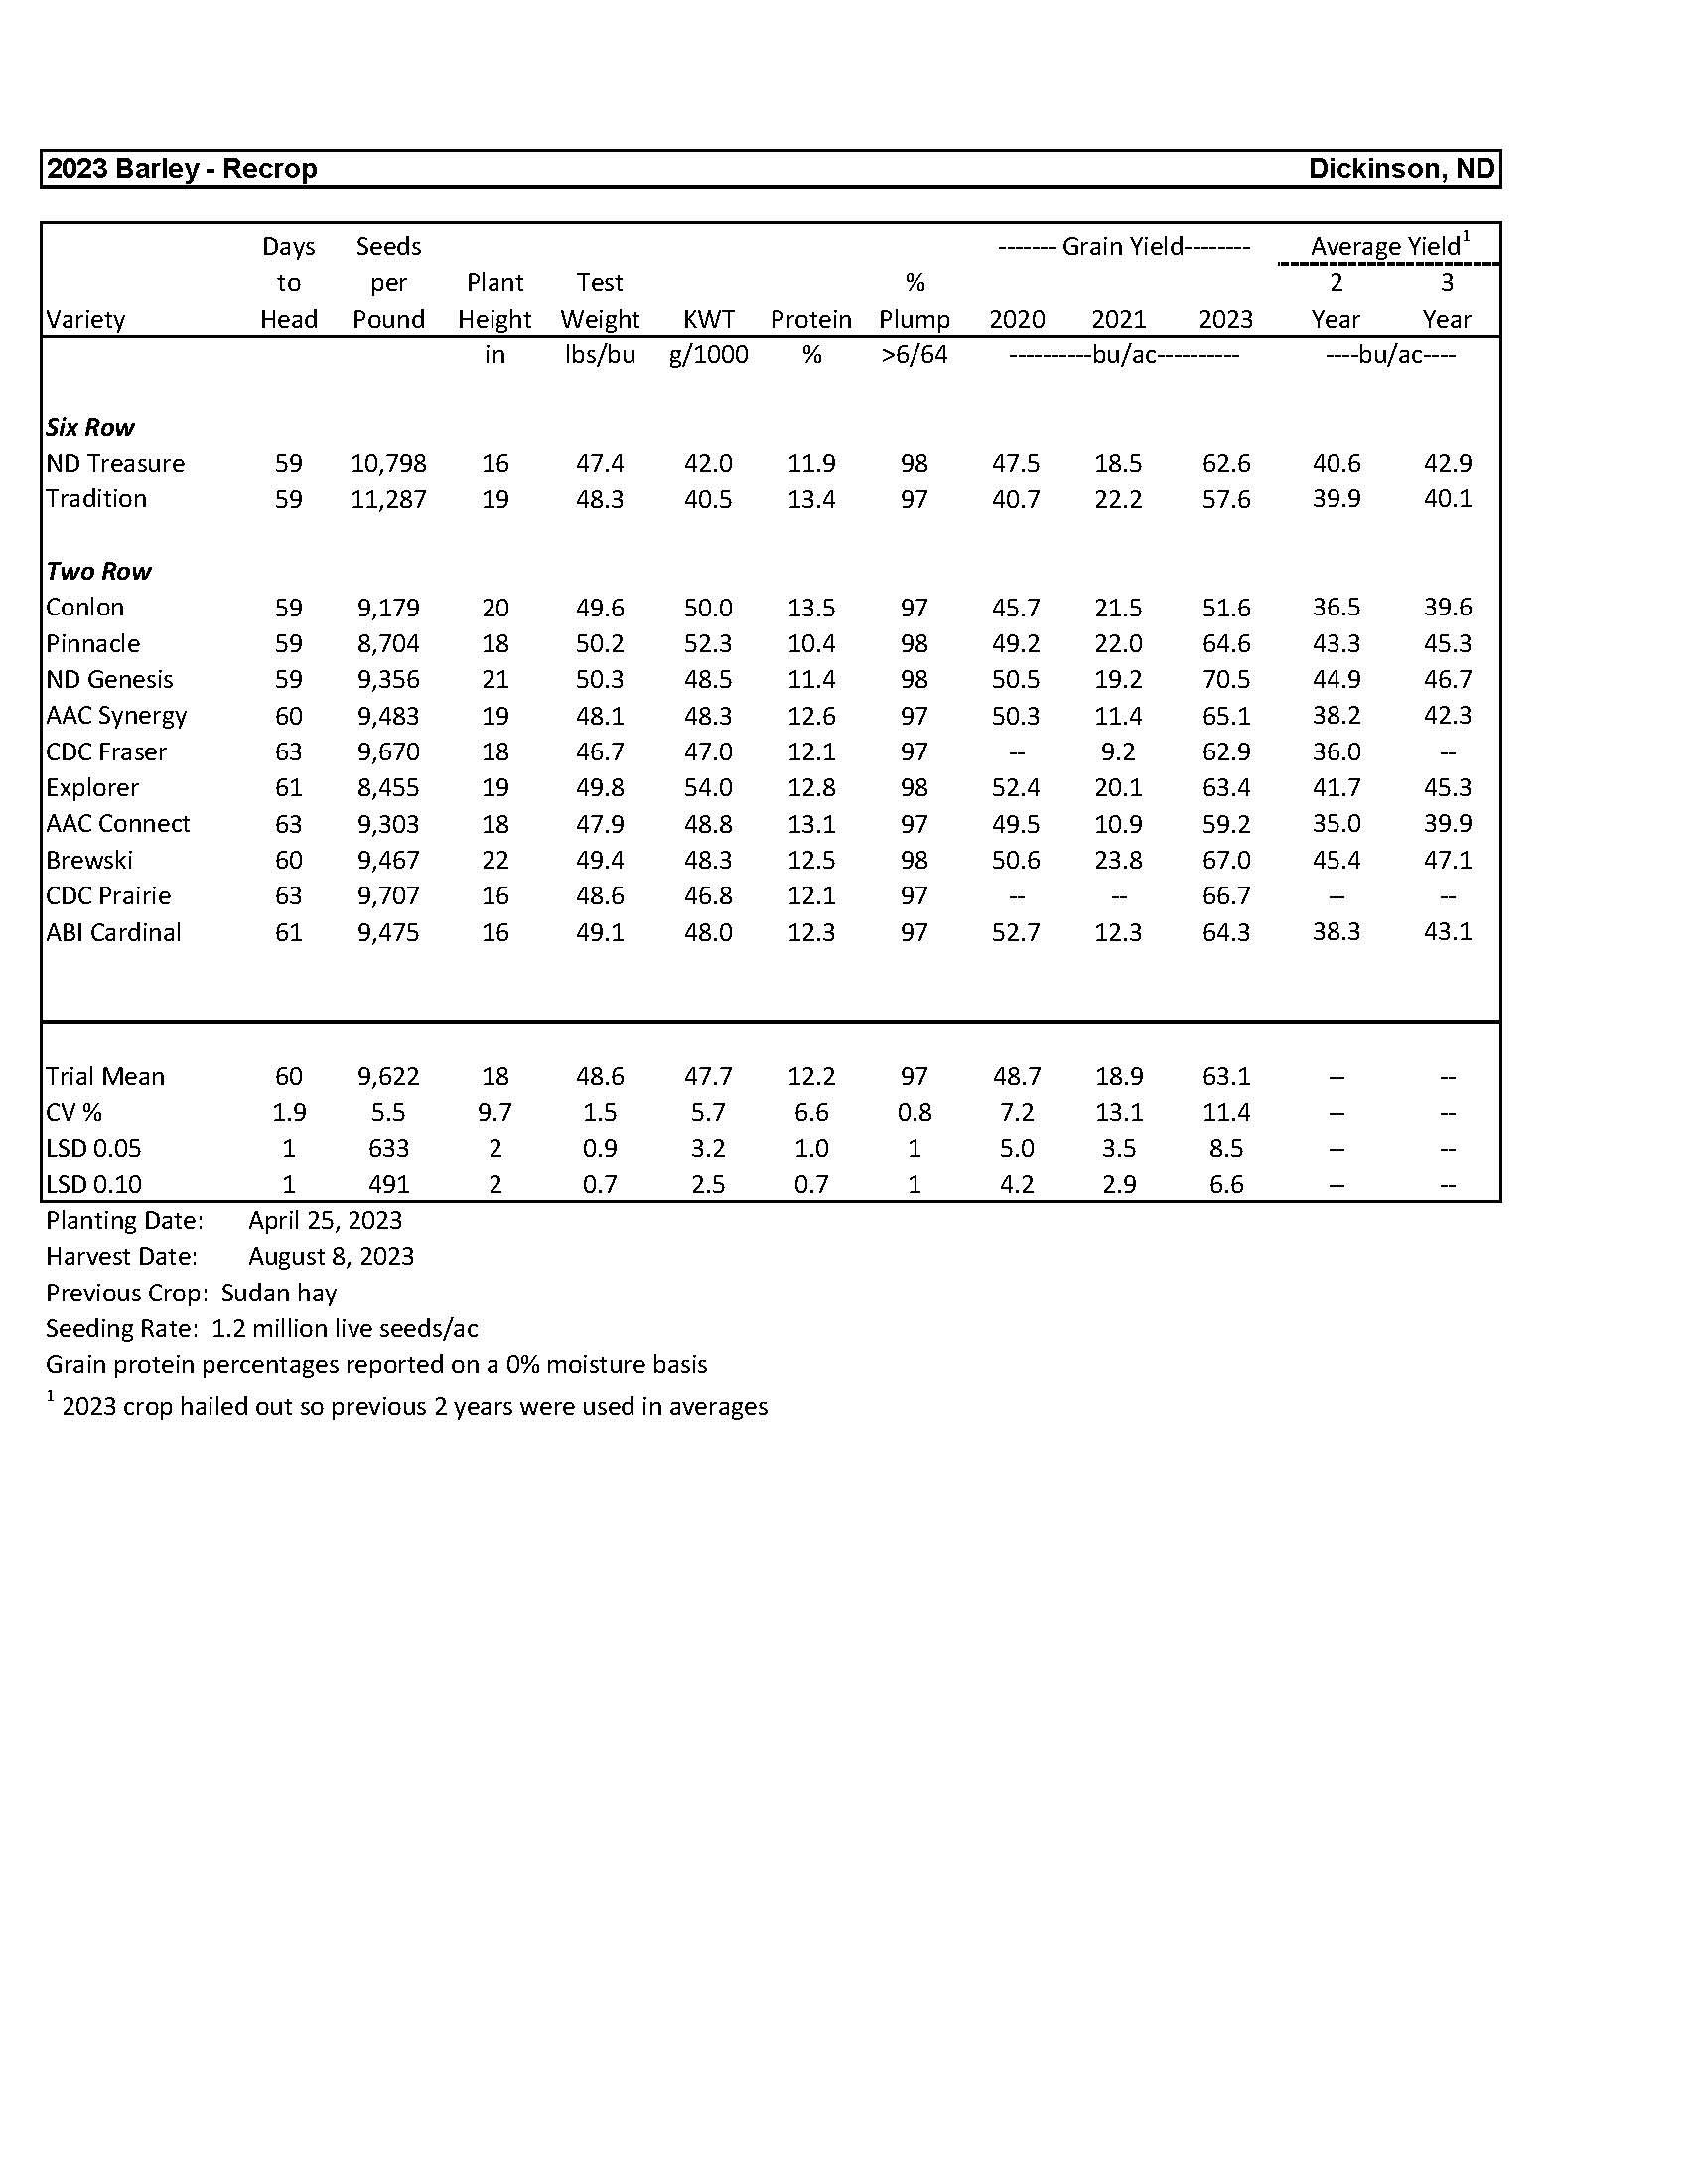
| Barley | 3 |
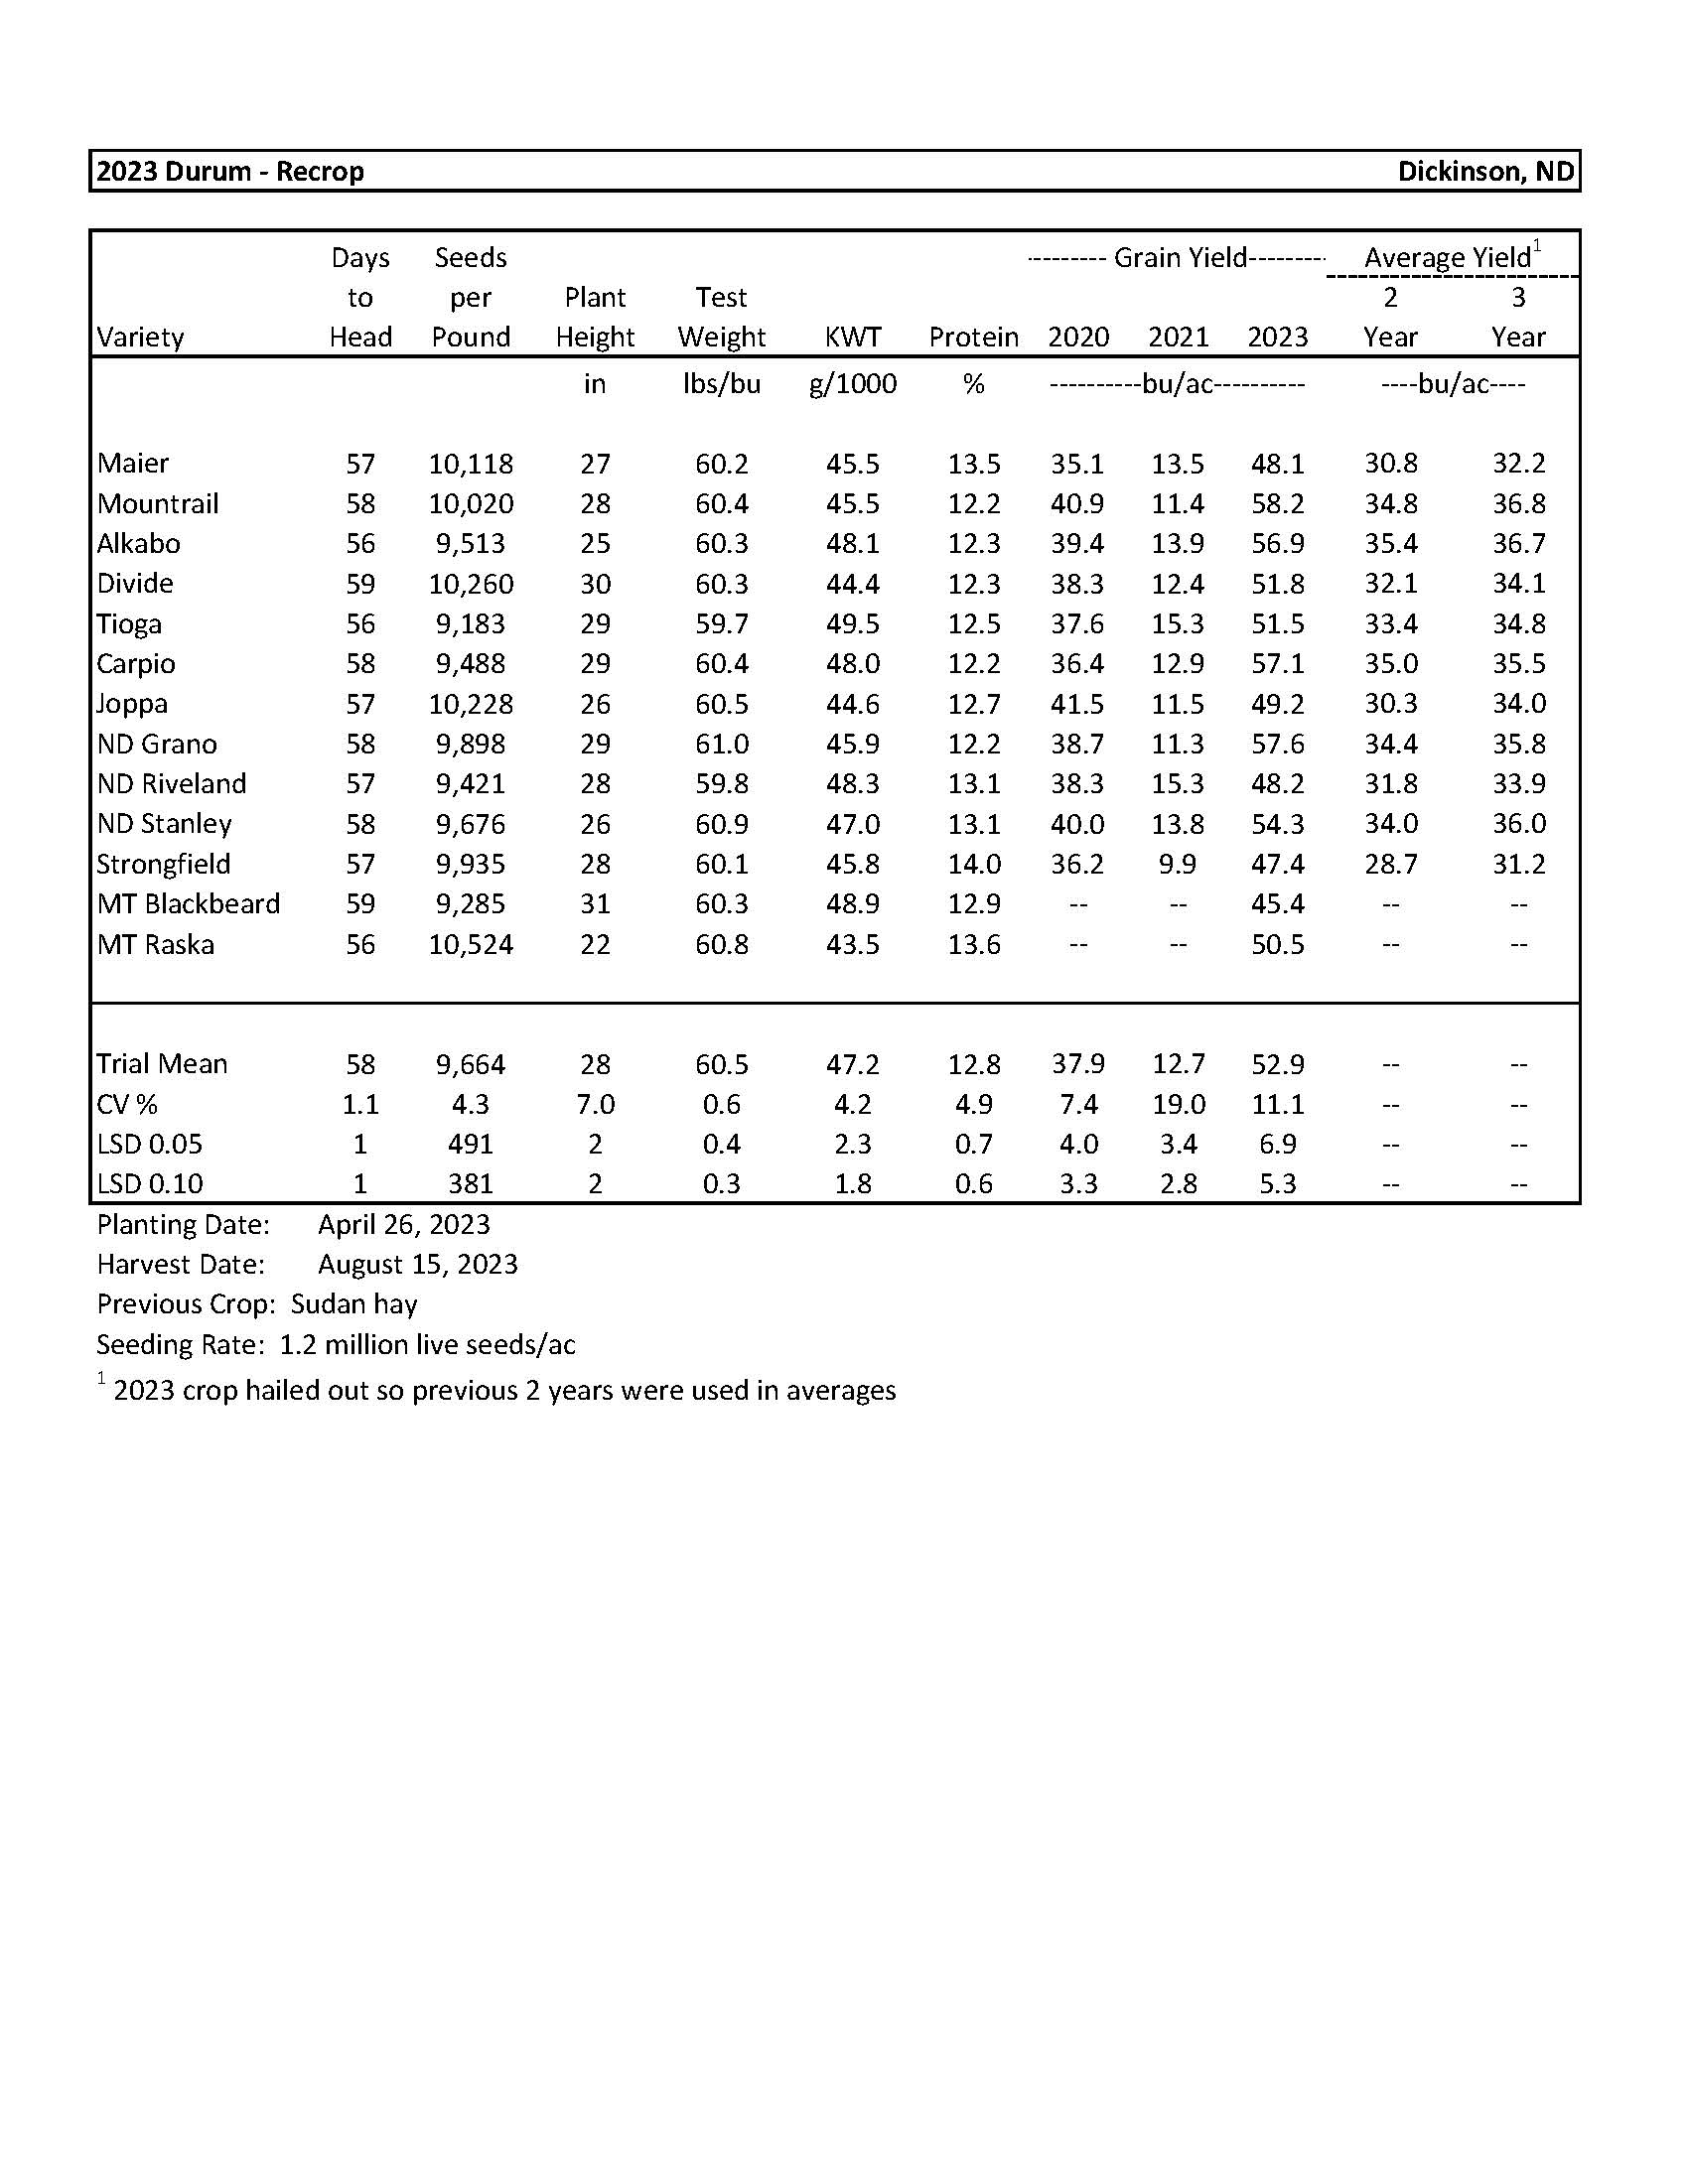
| Durum | 4 |
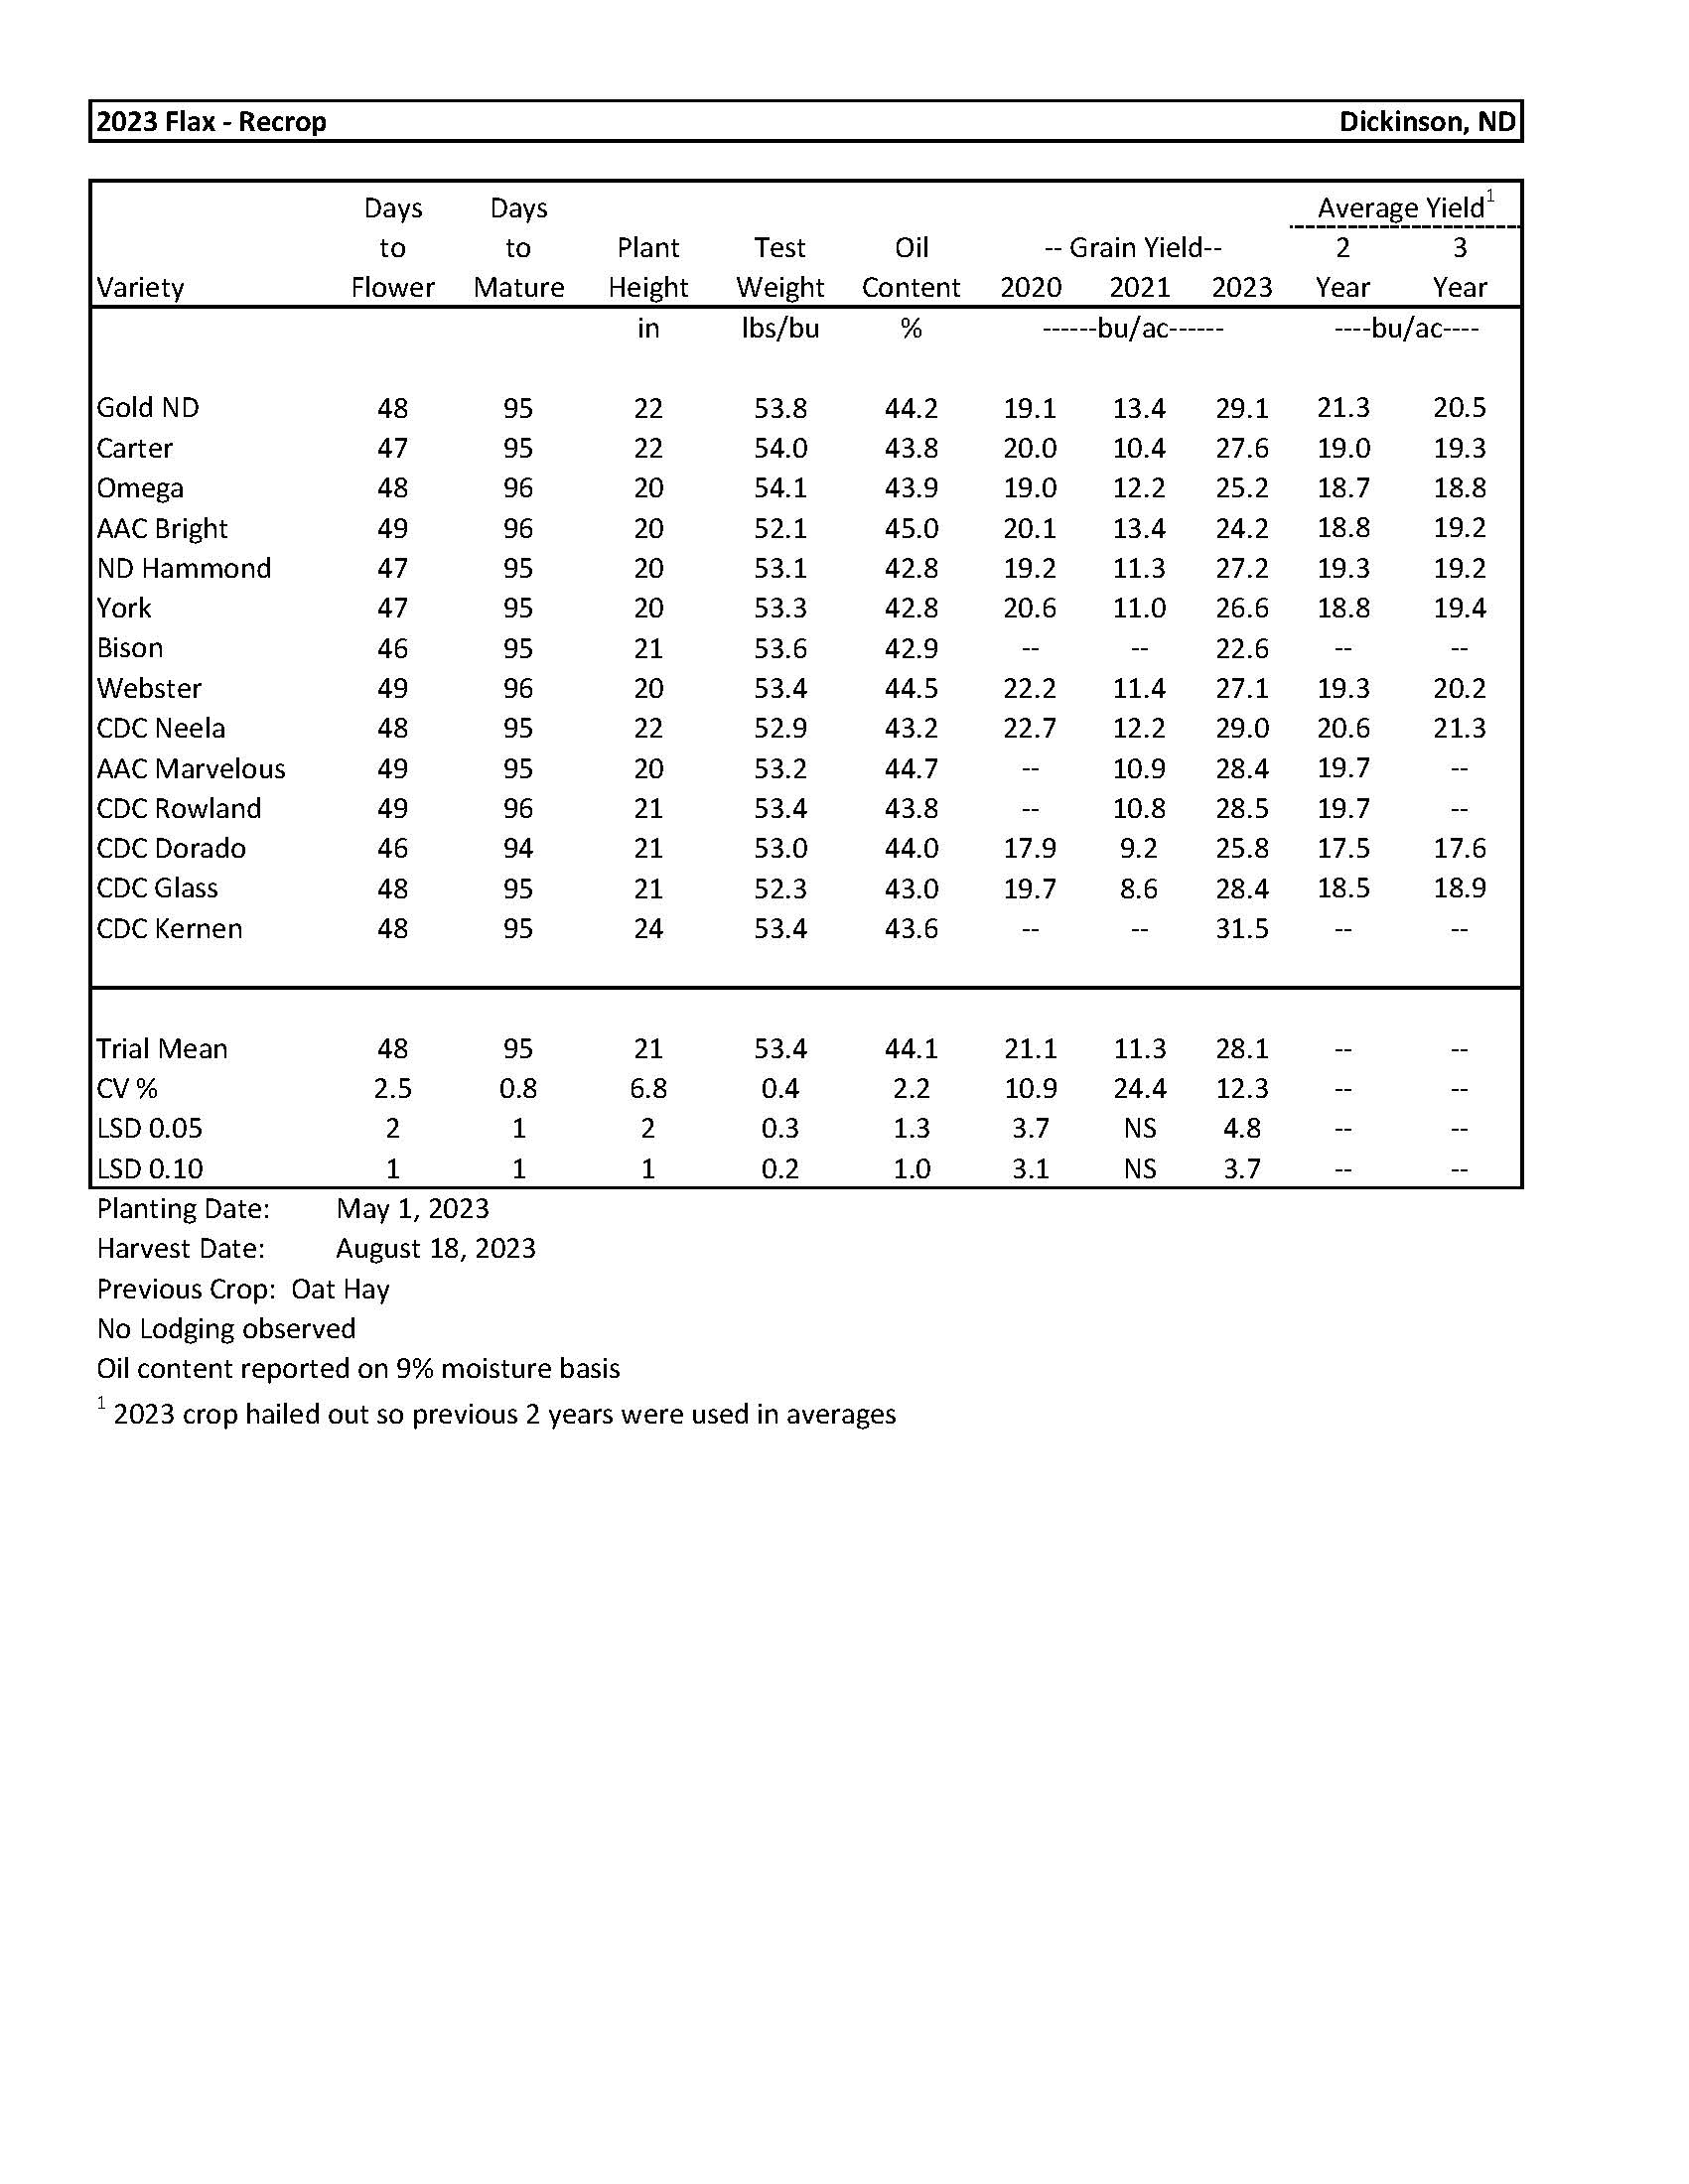
| Flax | 5 |
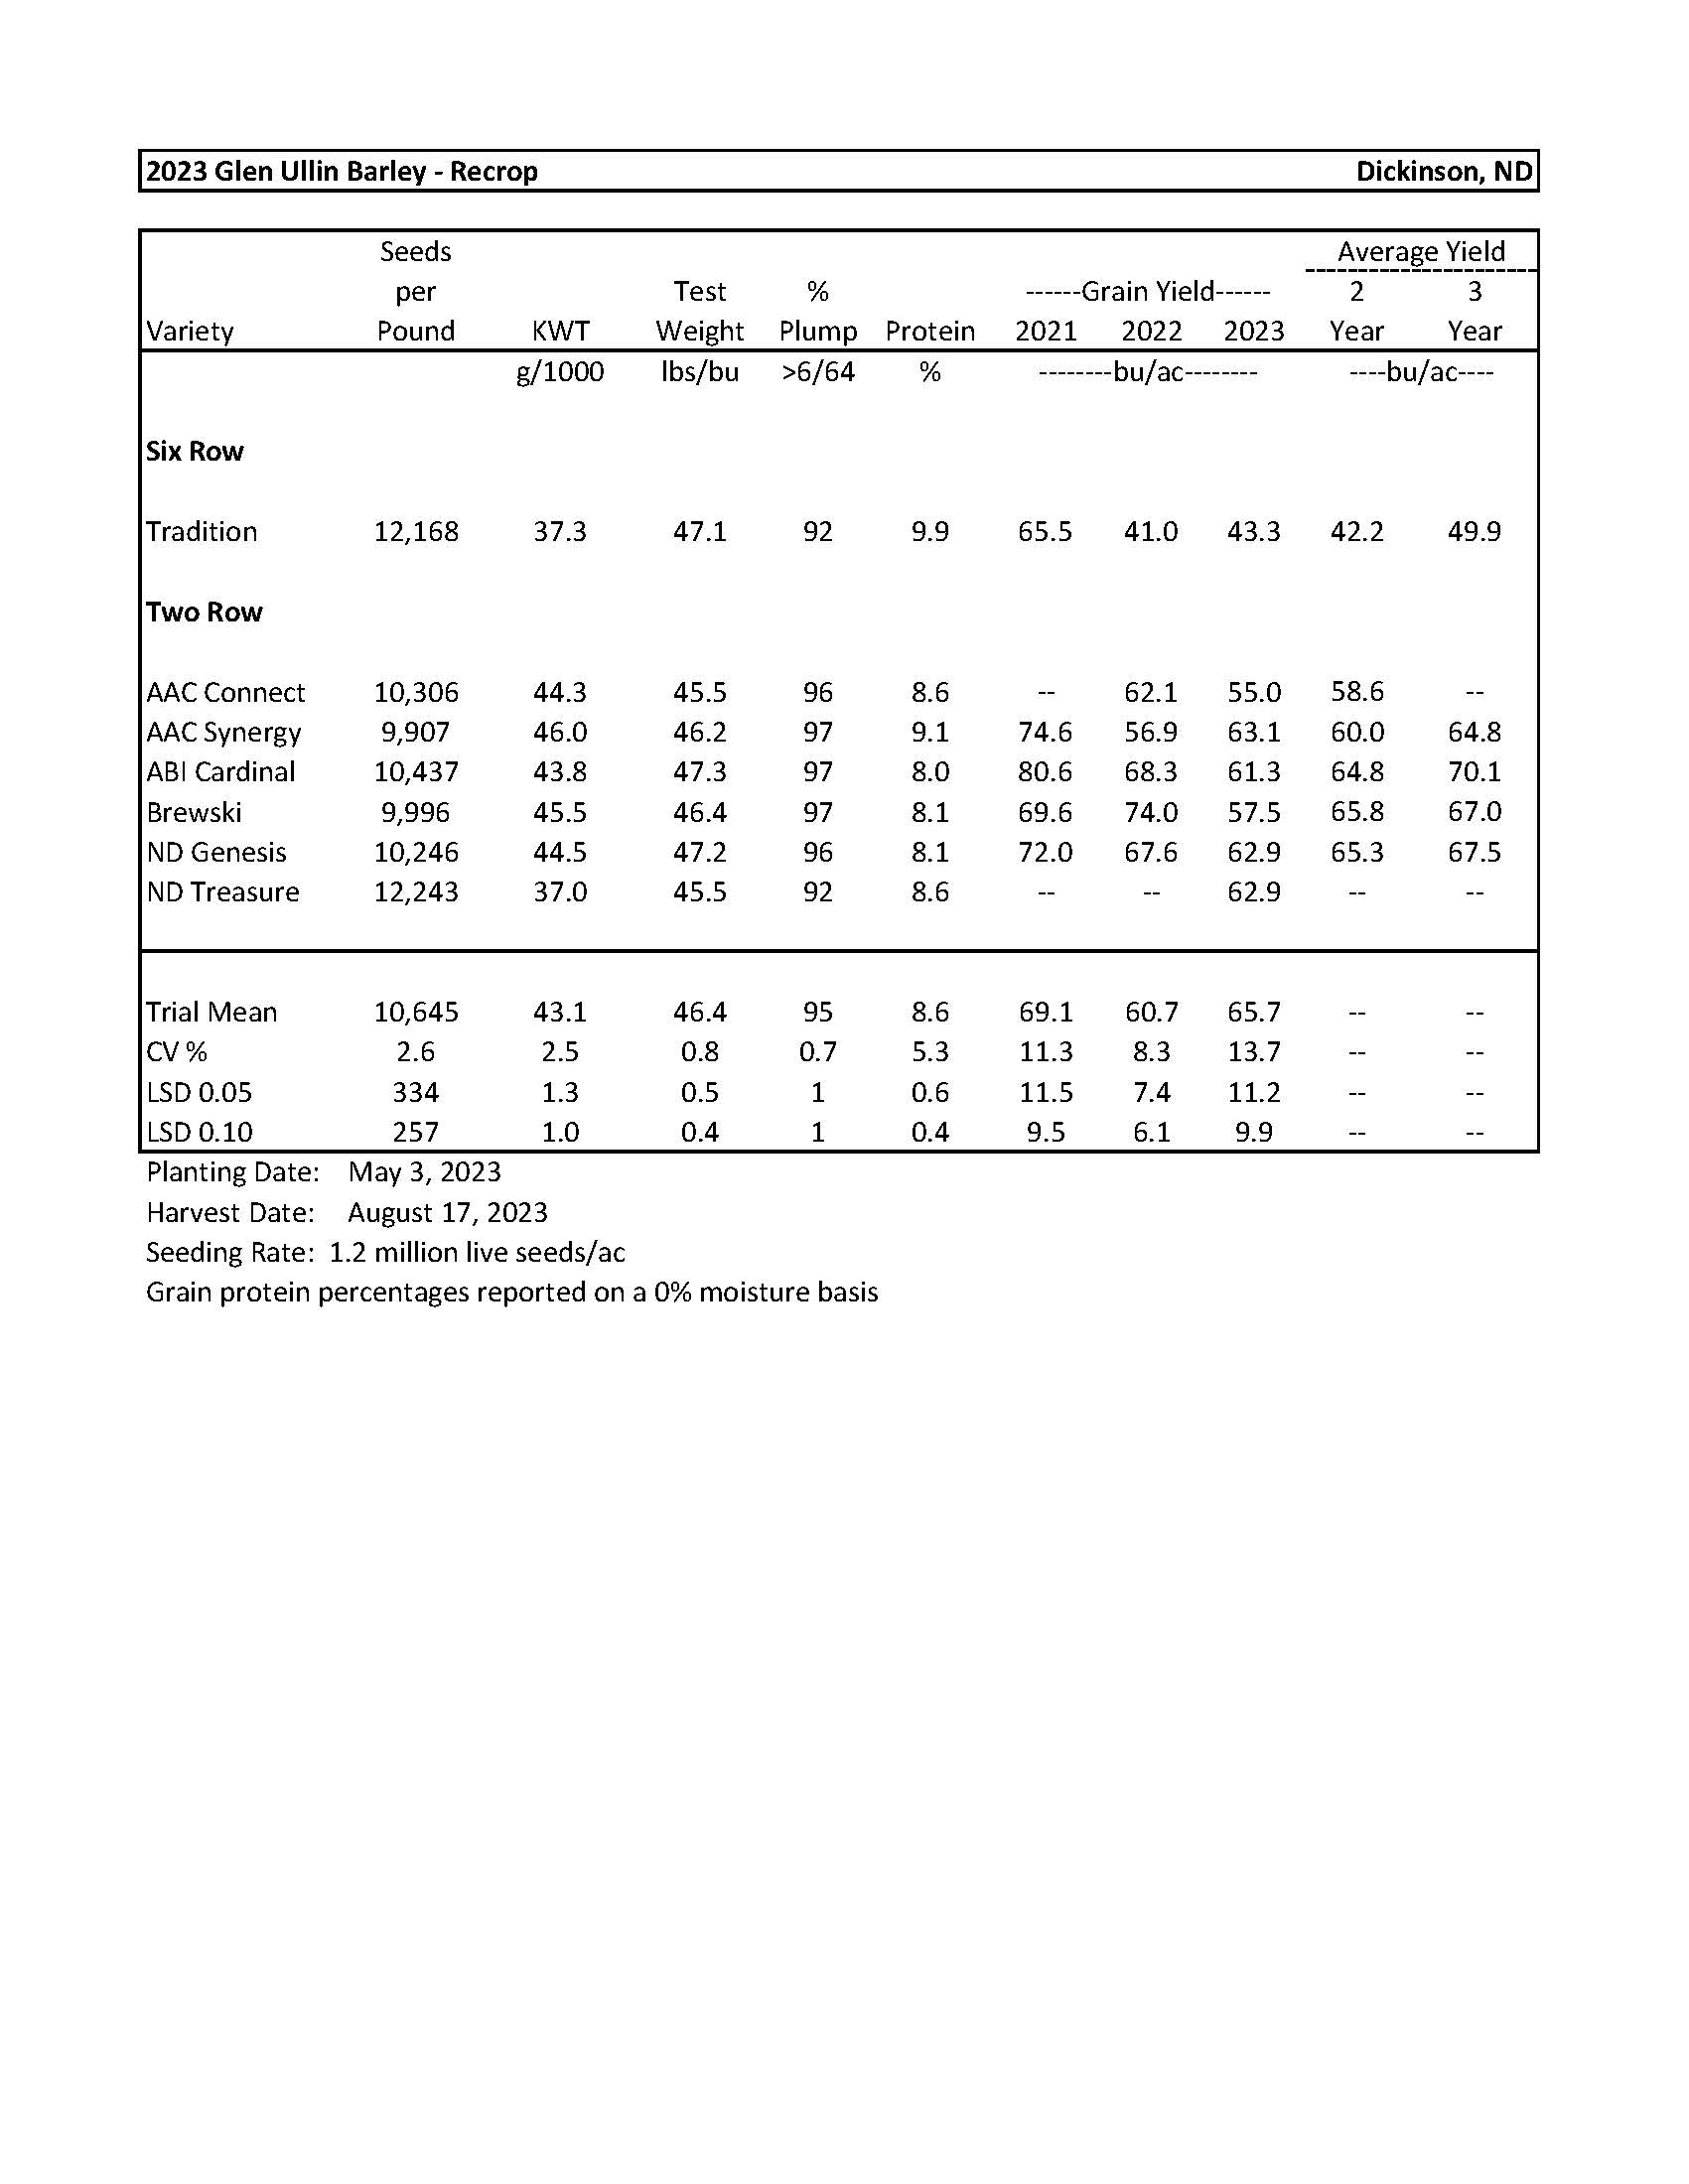
| Barley-Glen Ullin | 6 |
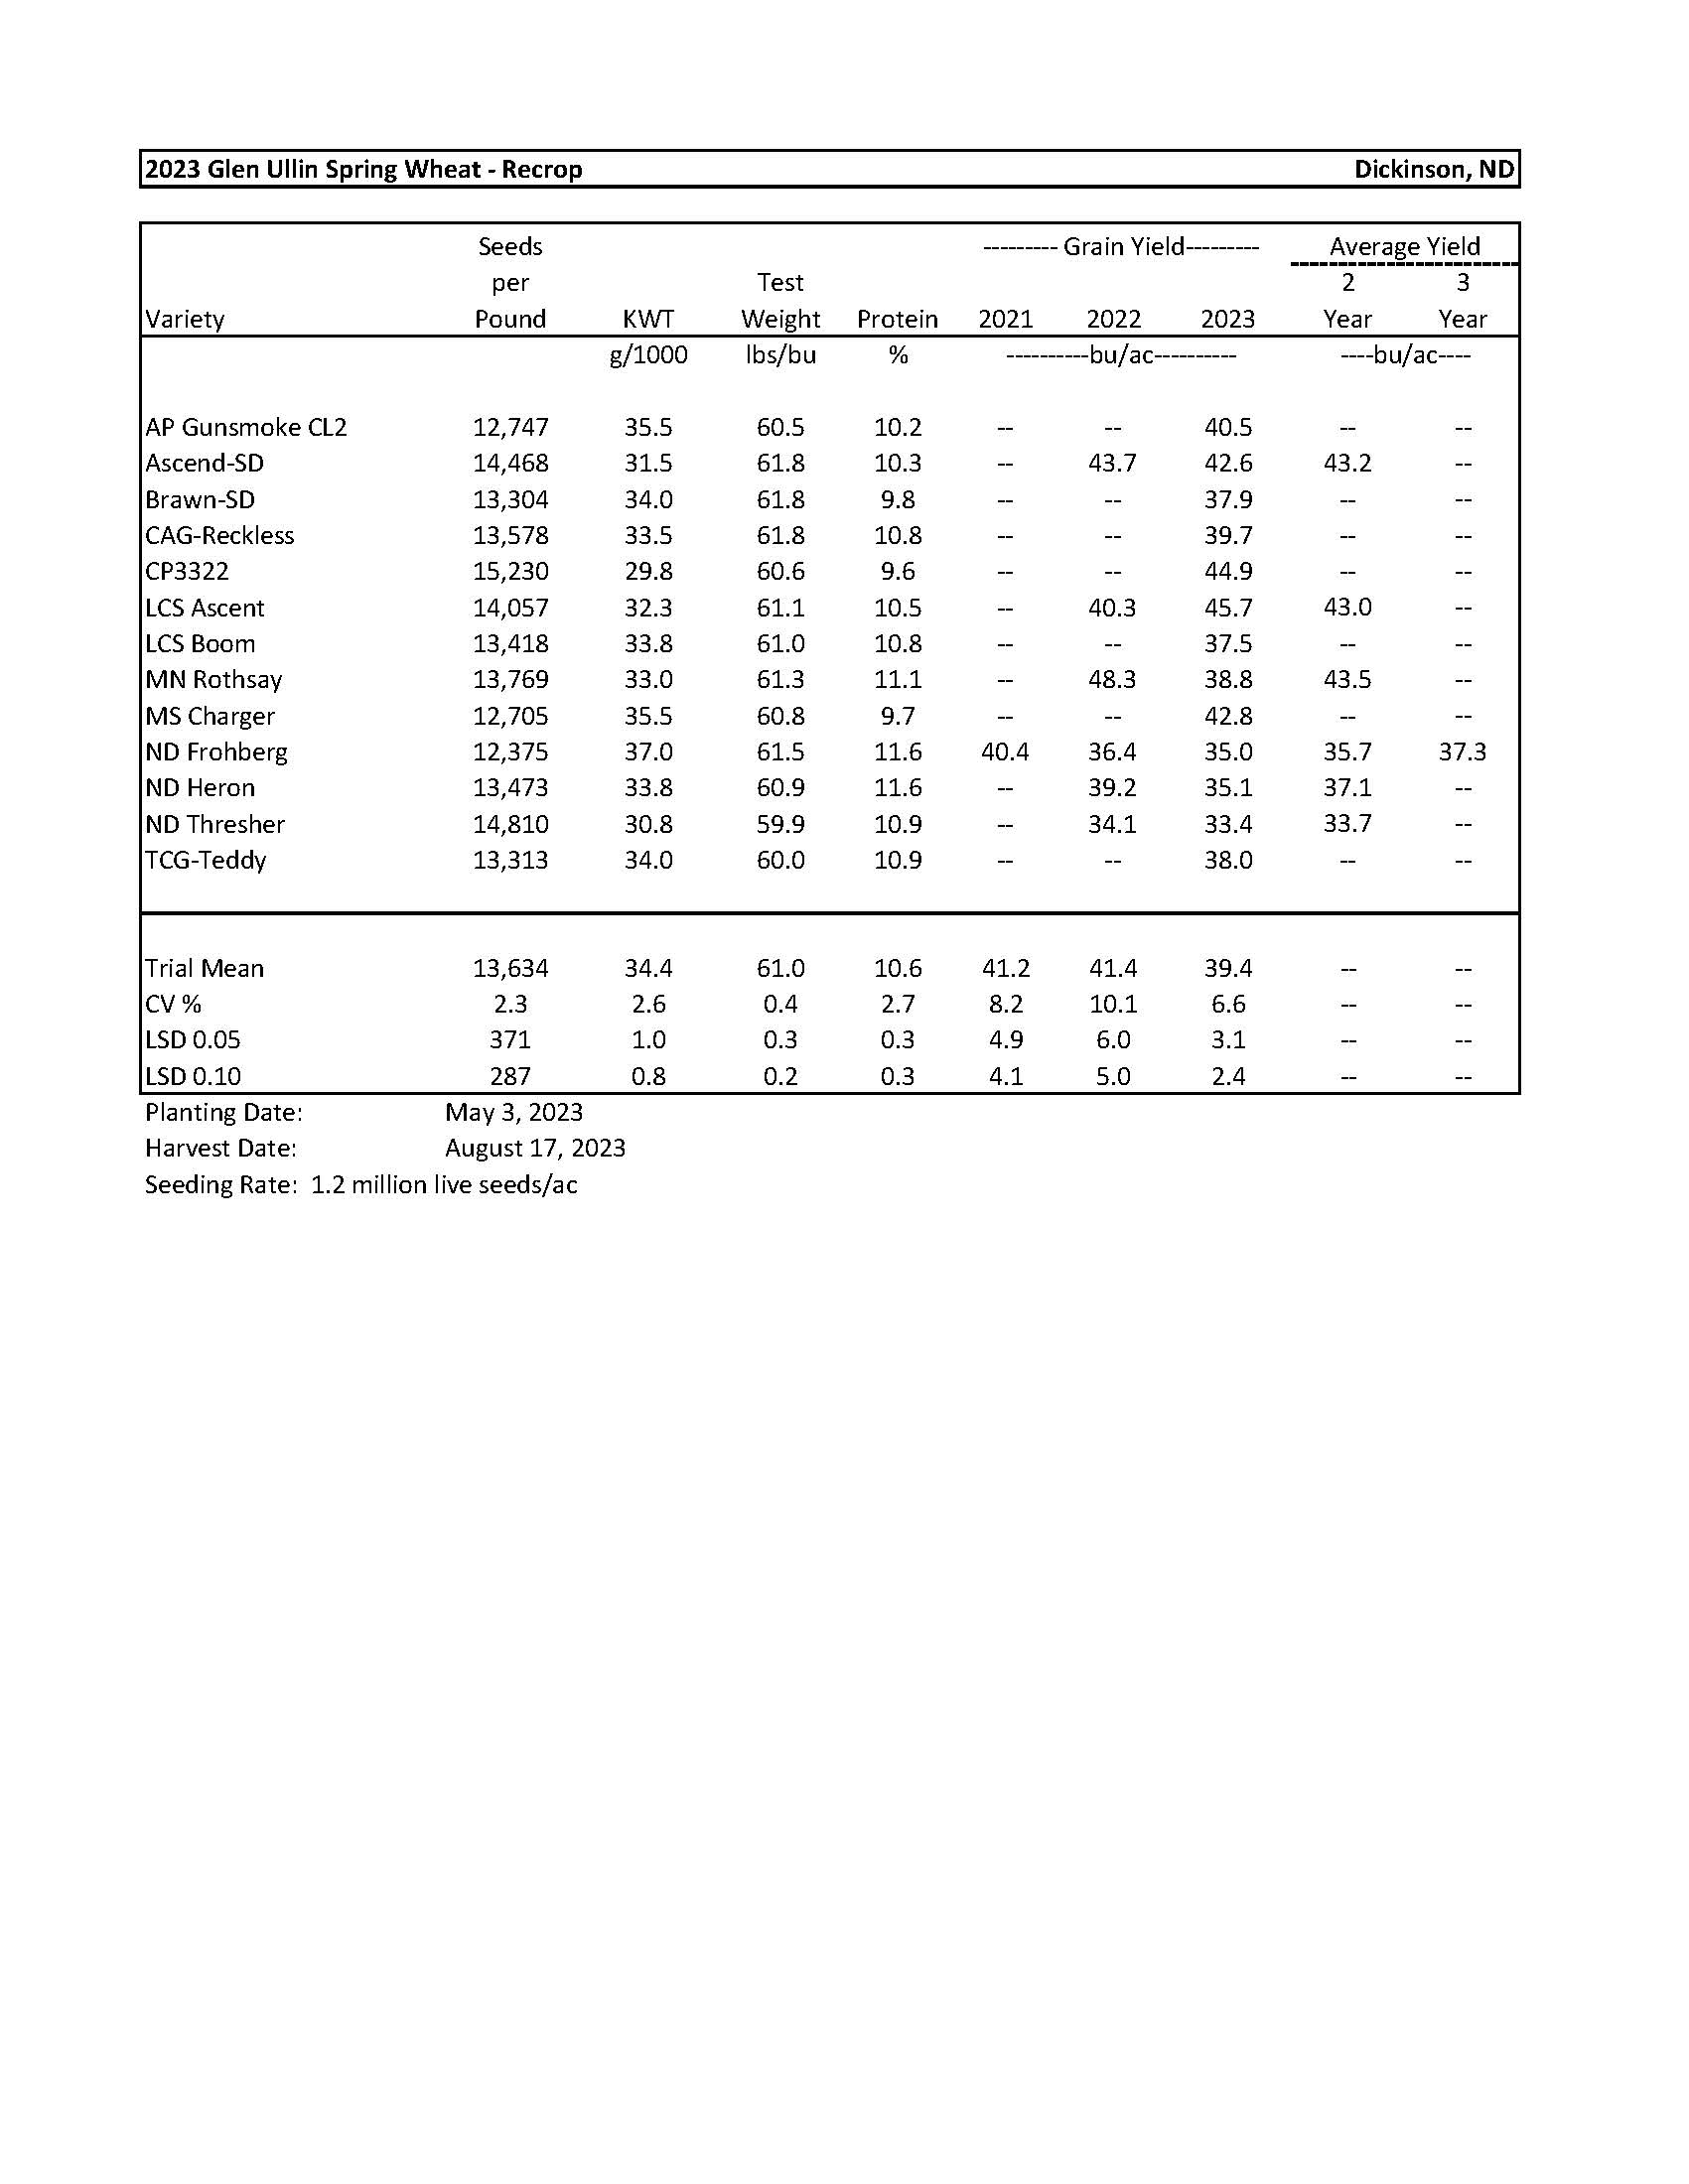
| Spring Wheat-Glen Ullin | 7 |
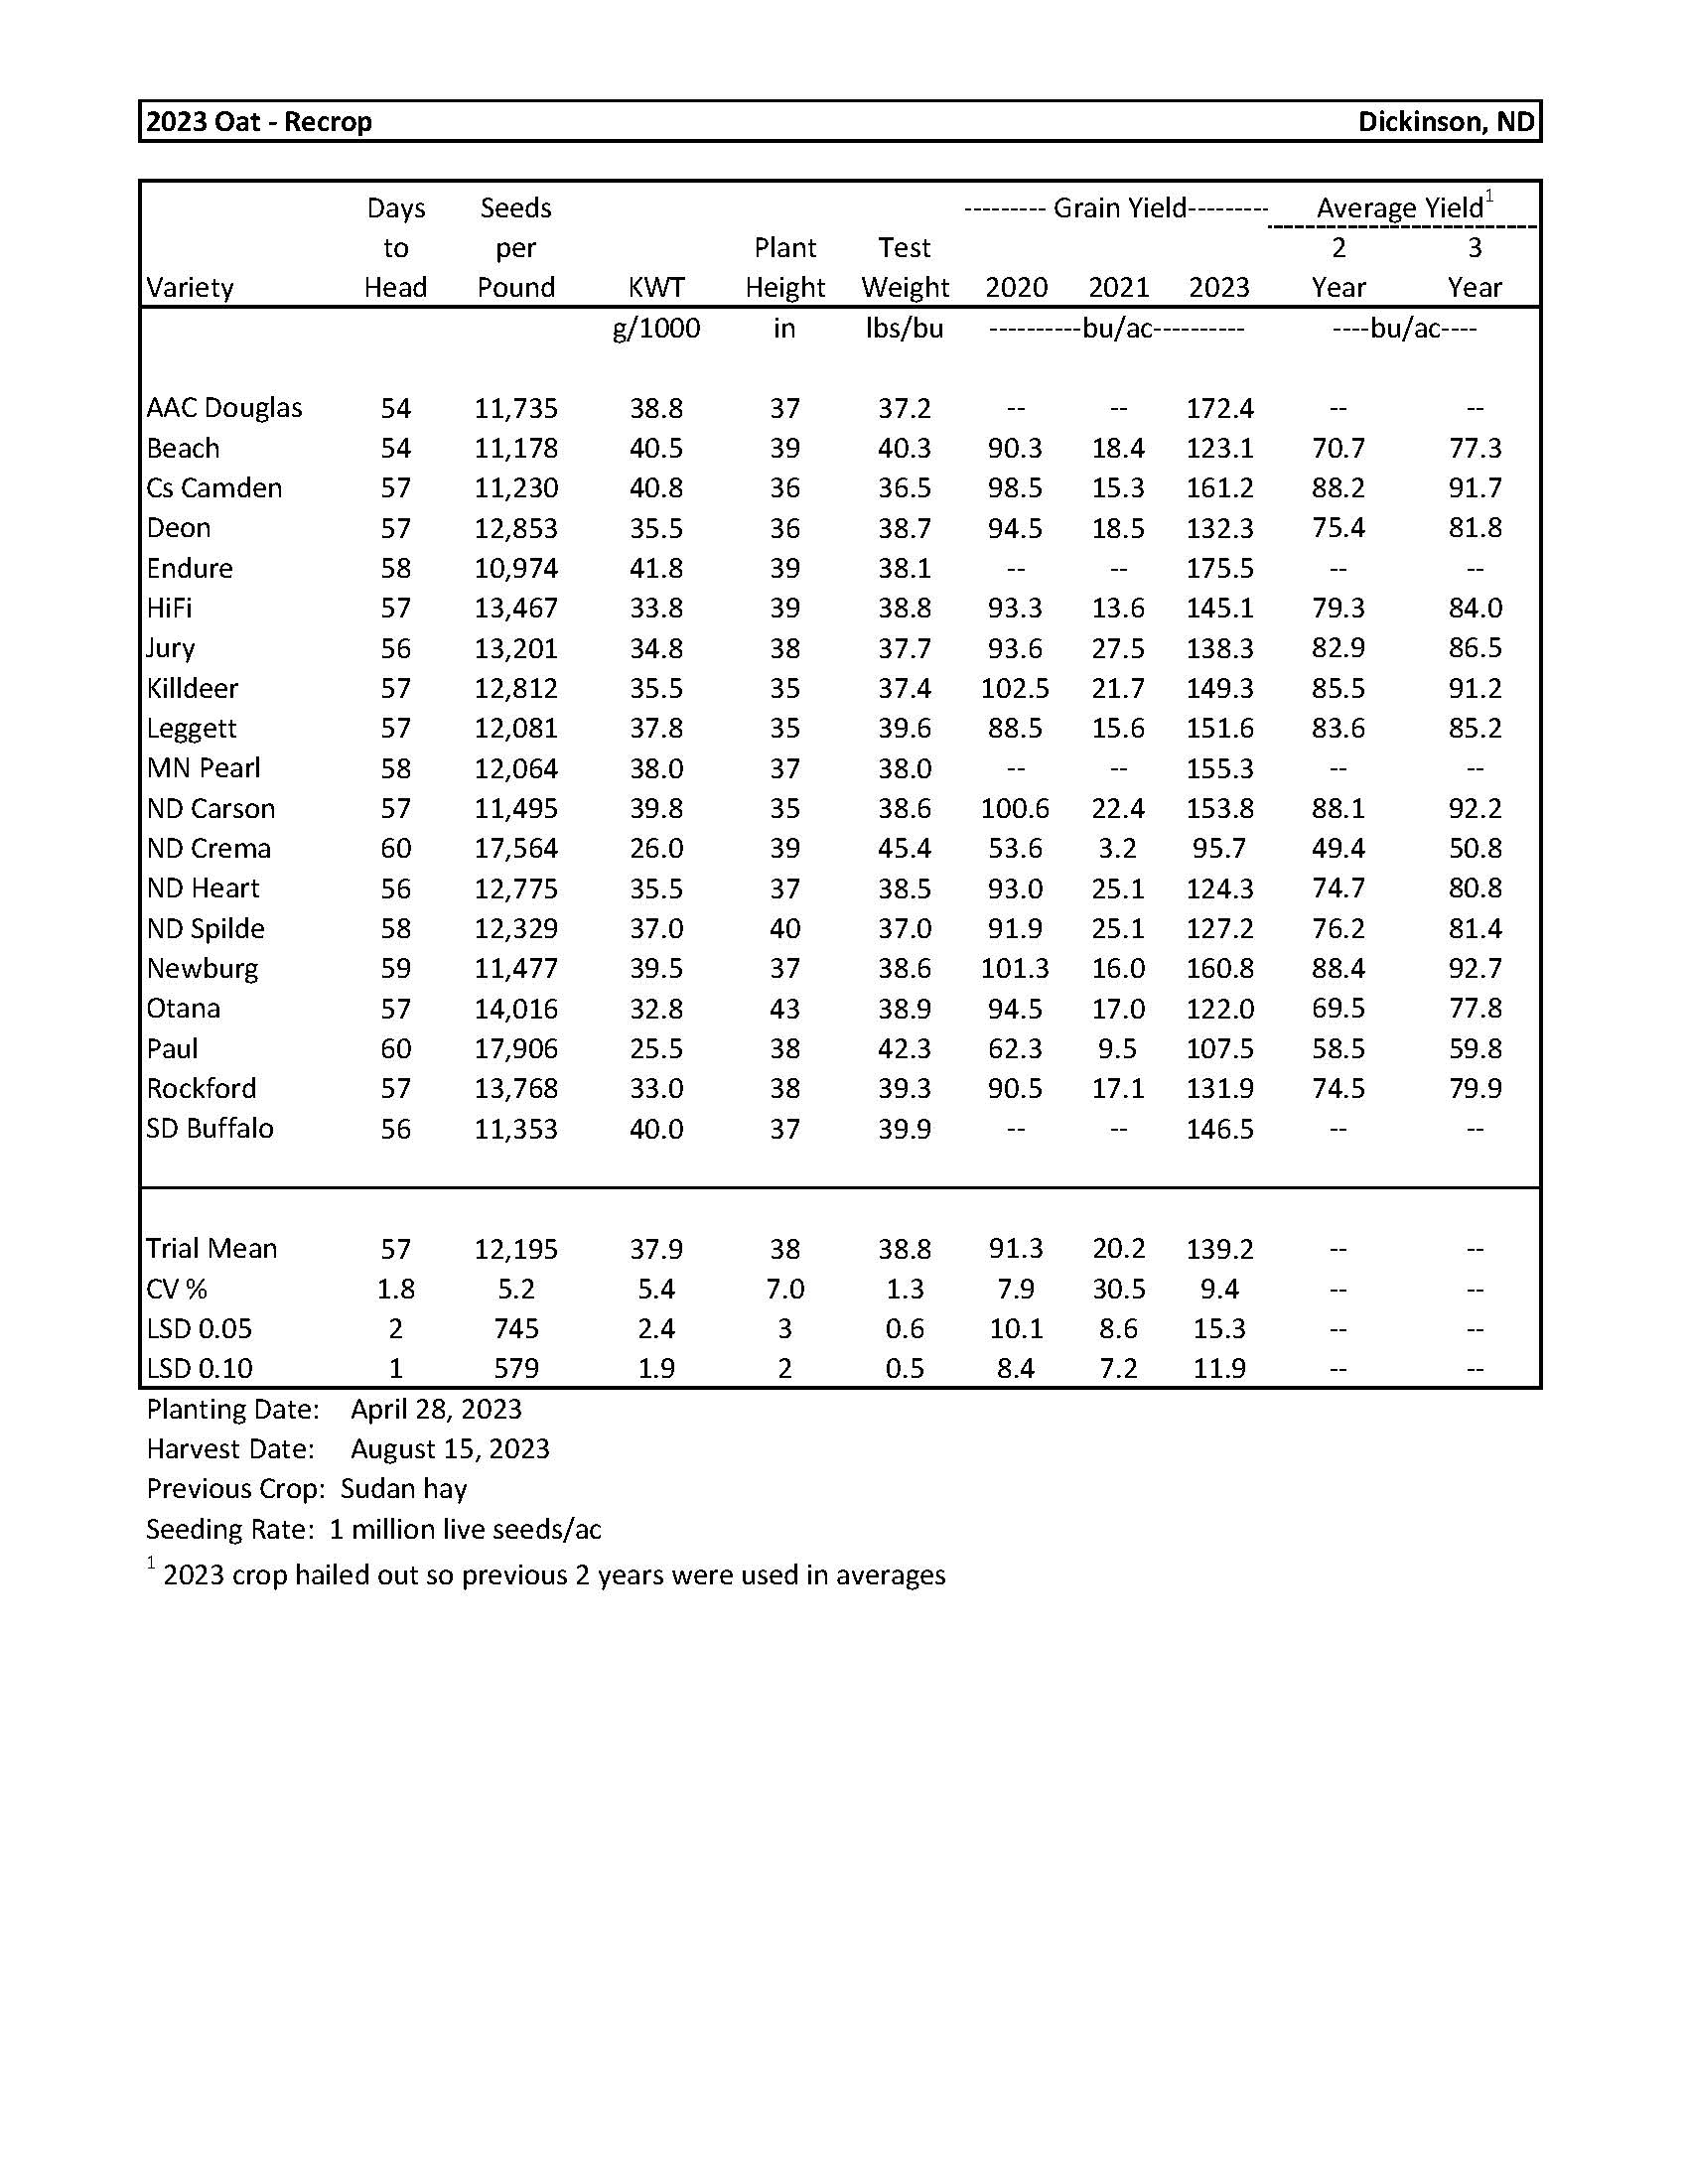
| Oat | 8 |
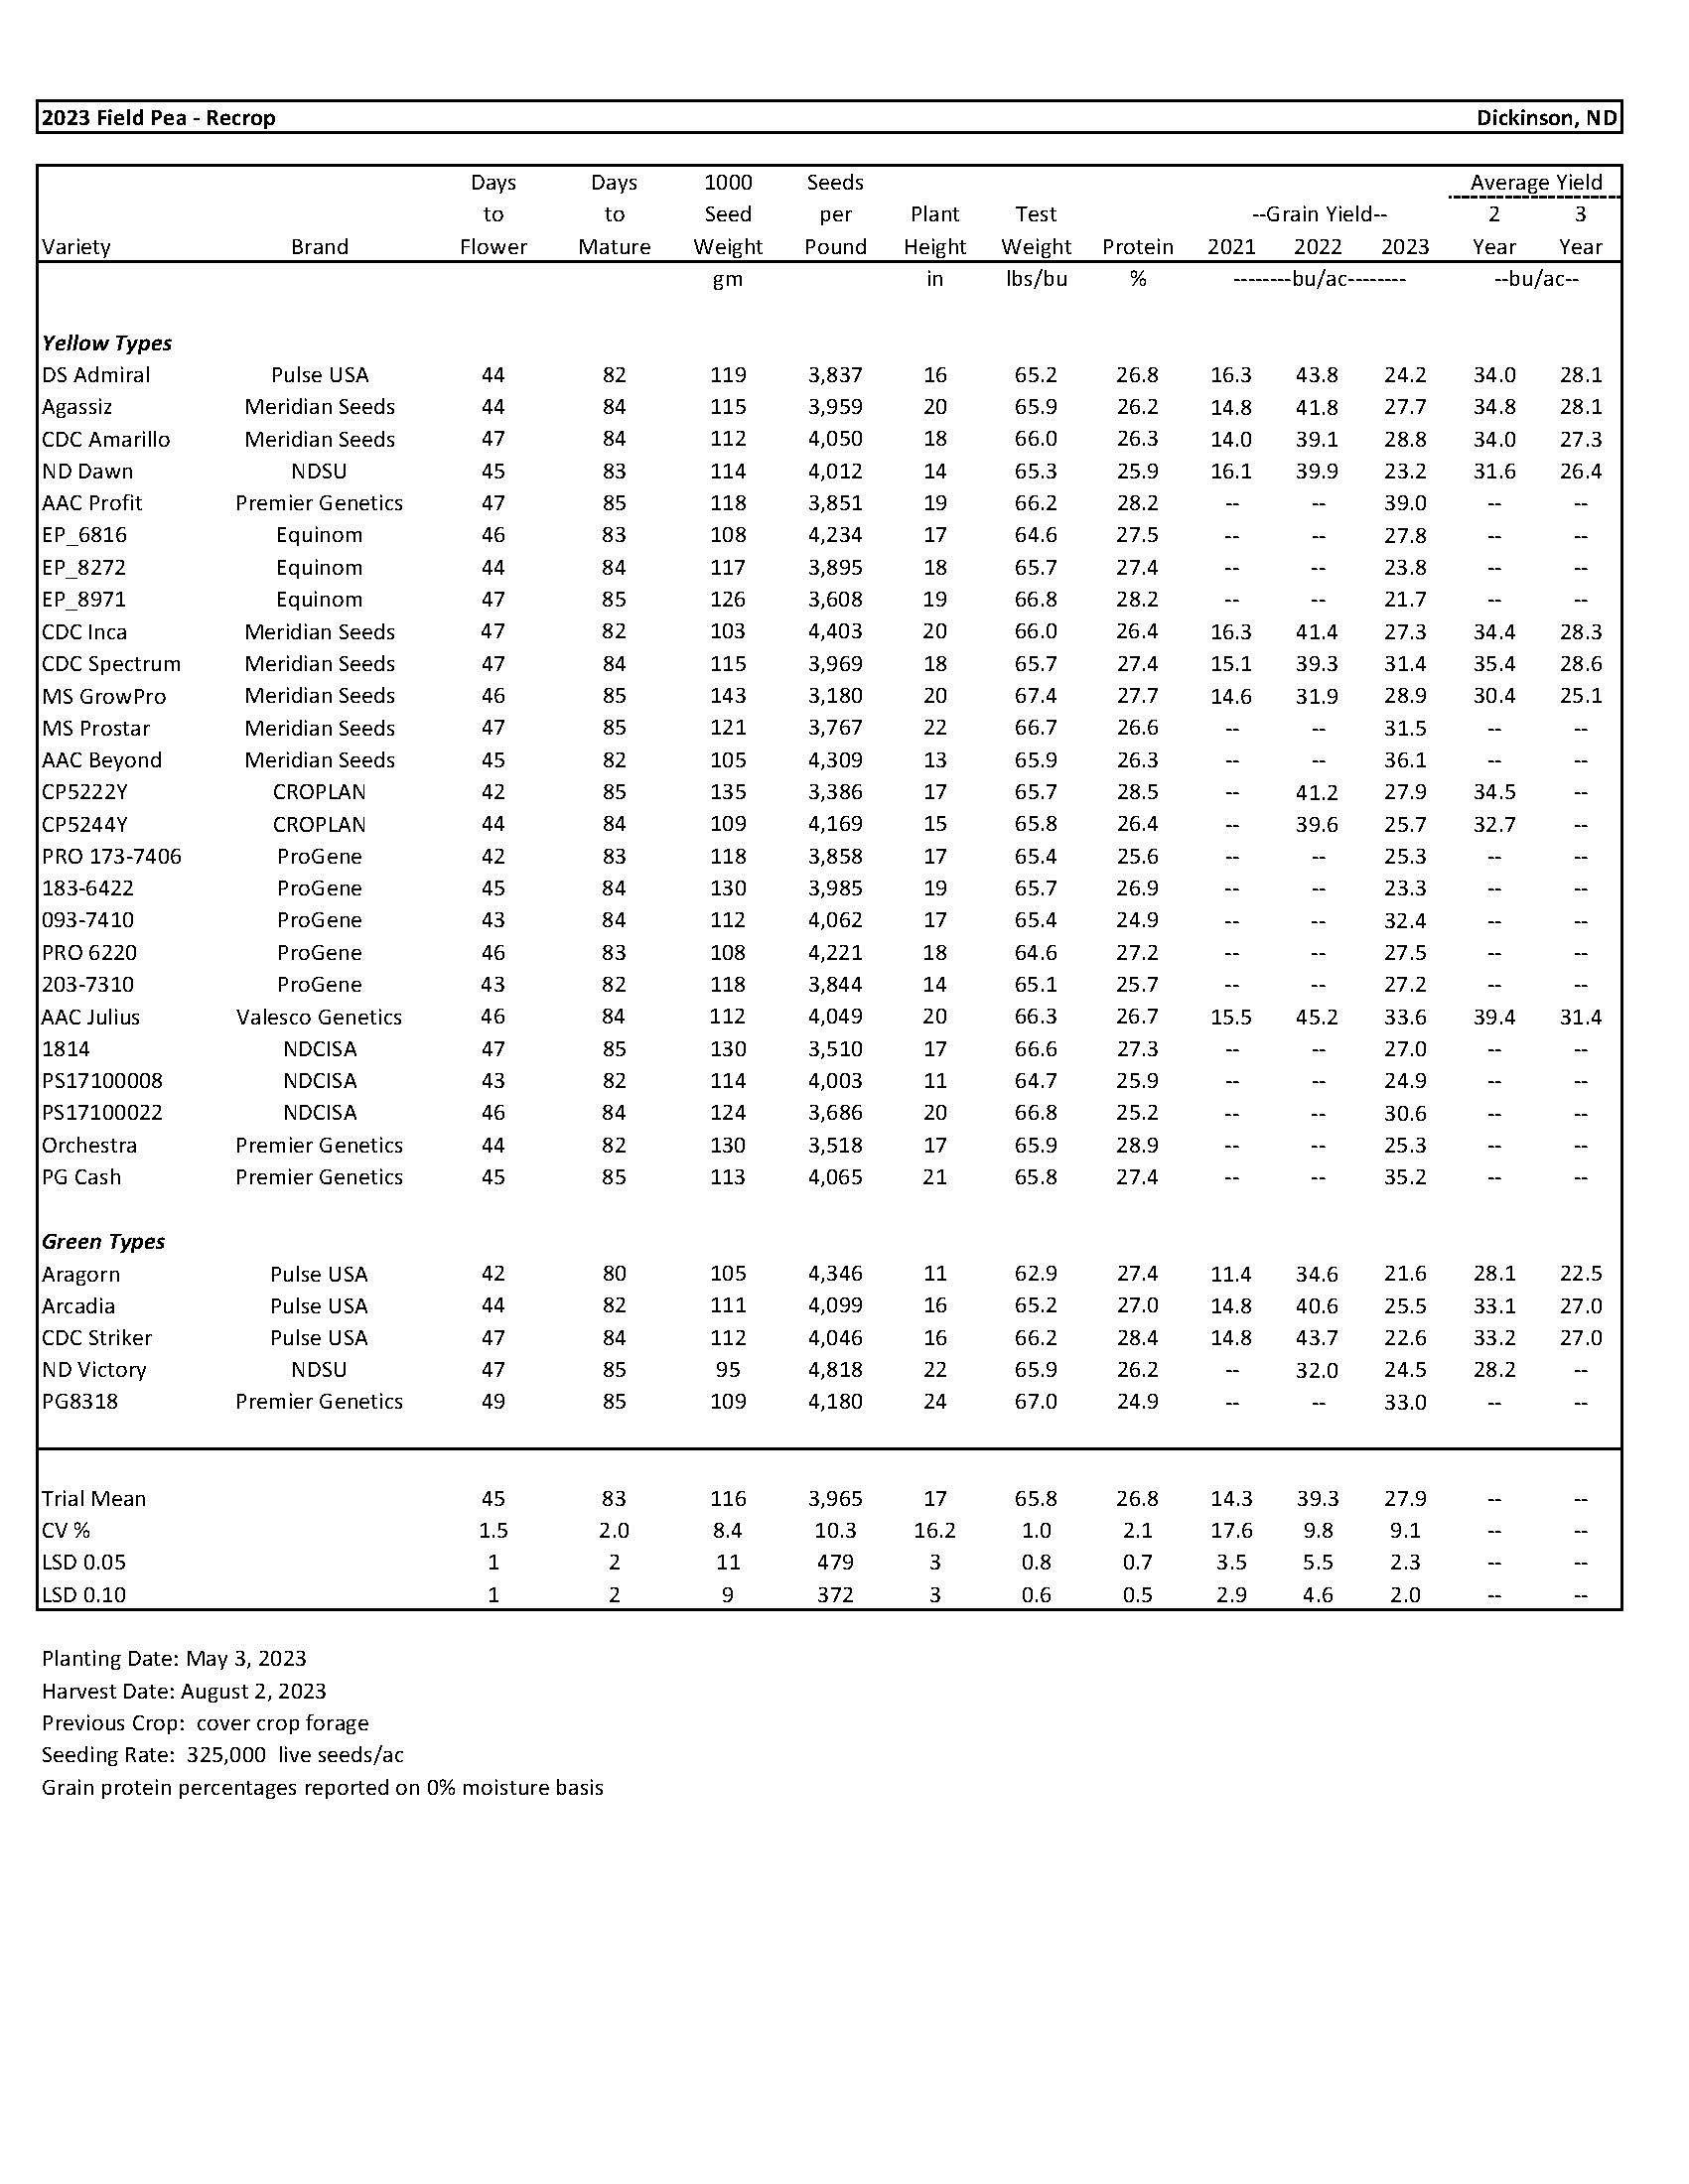
| Pea | 9 |
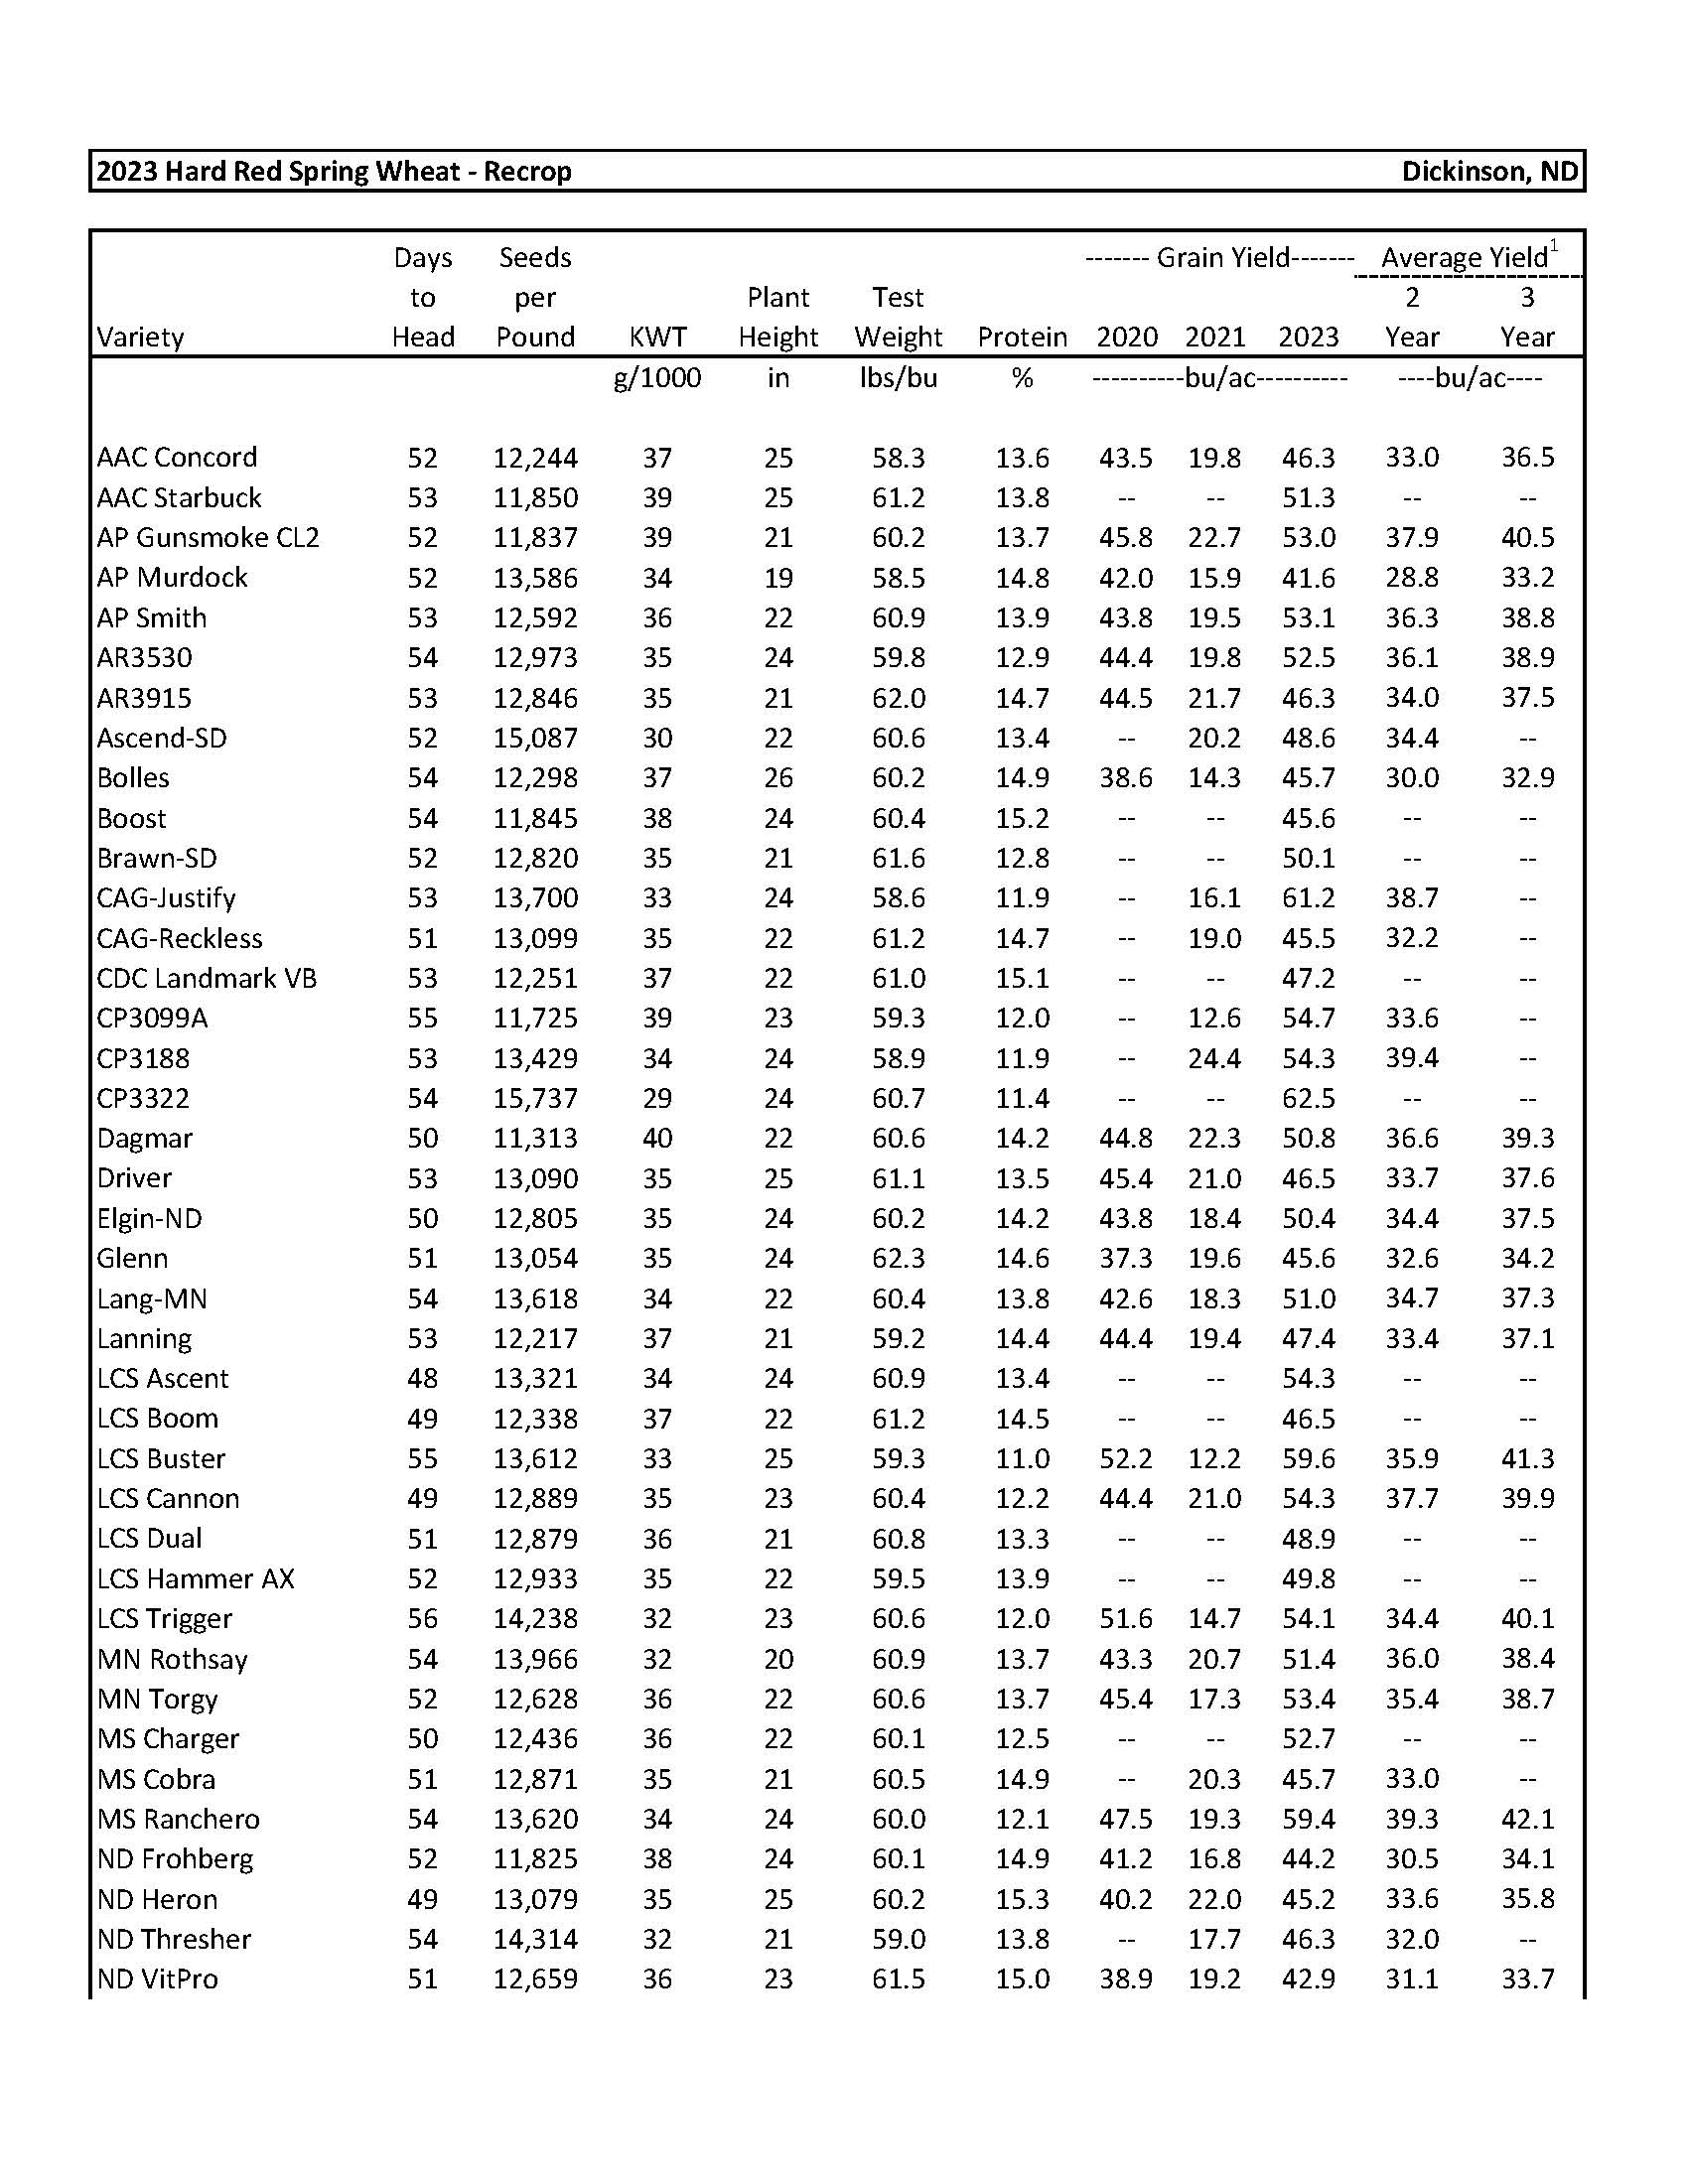
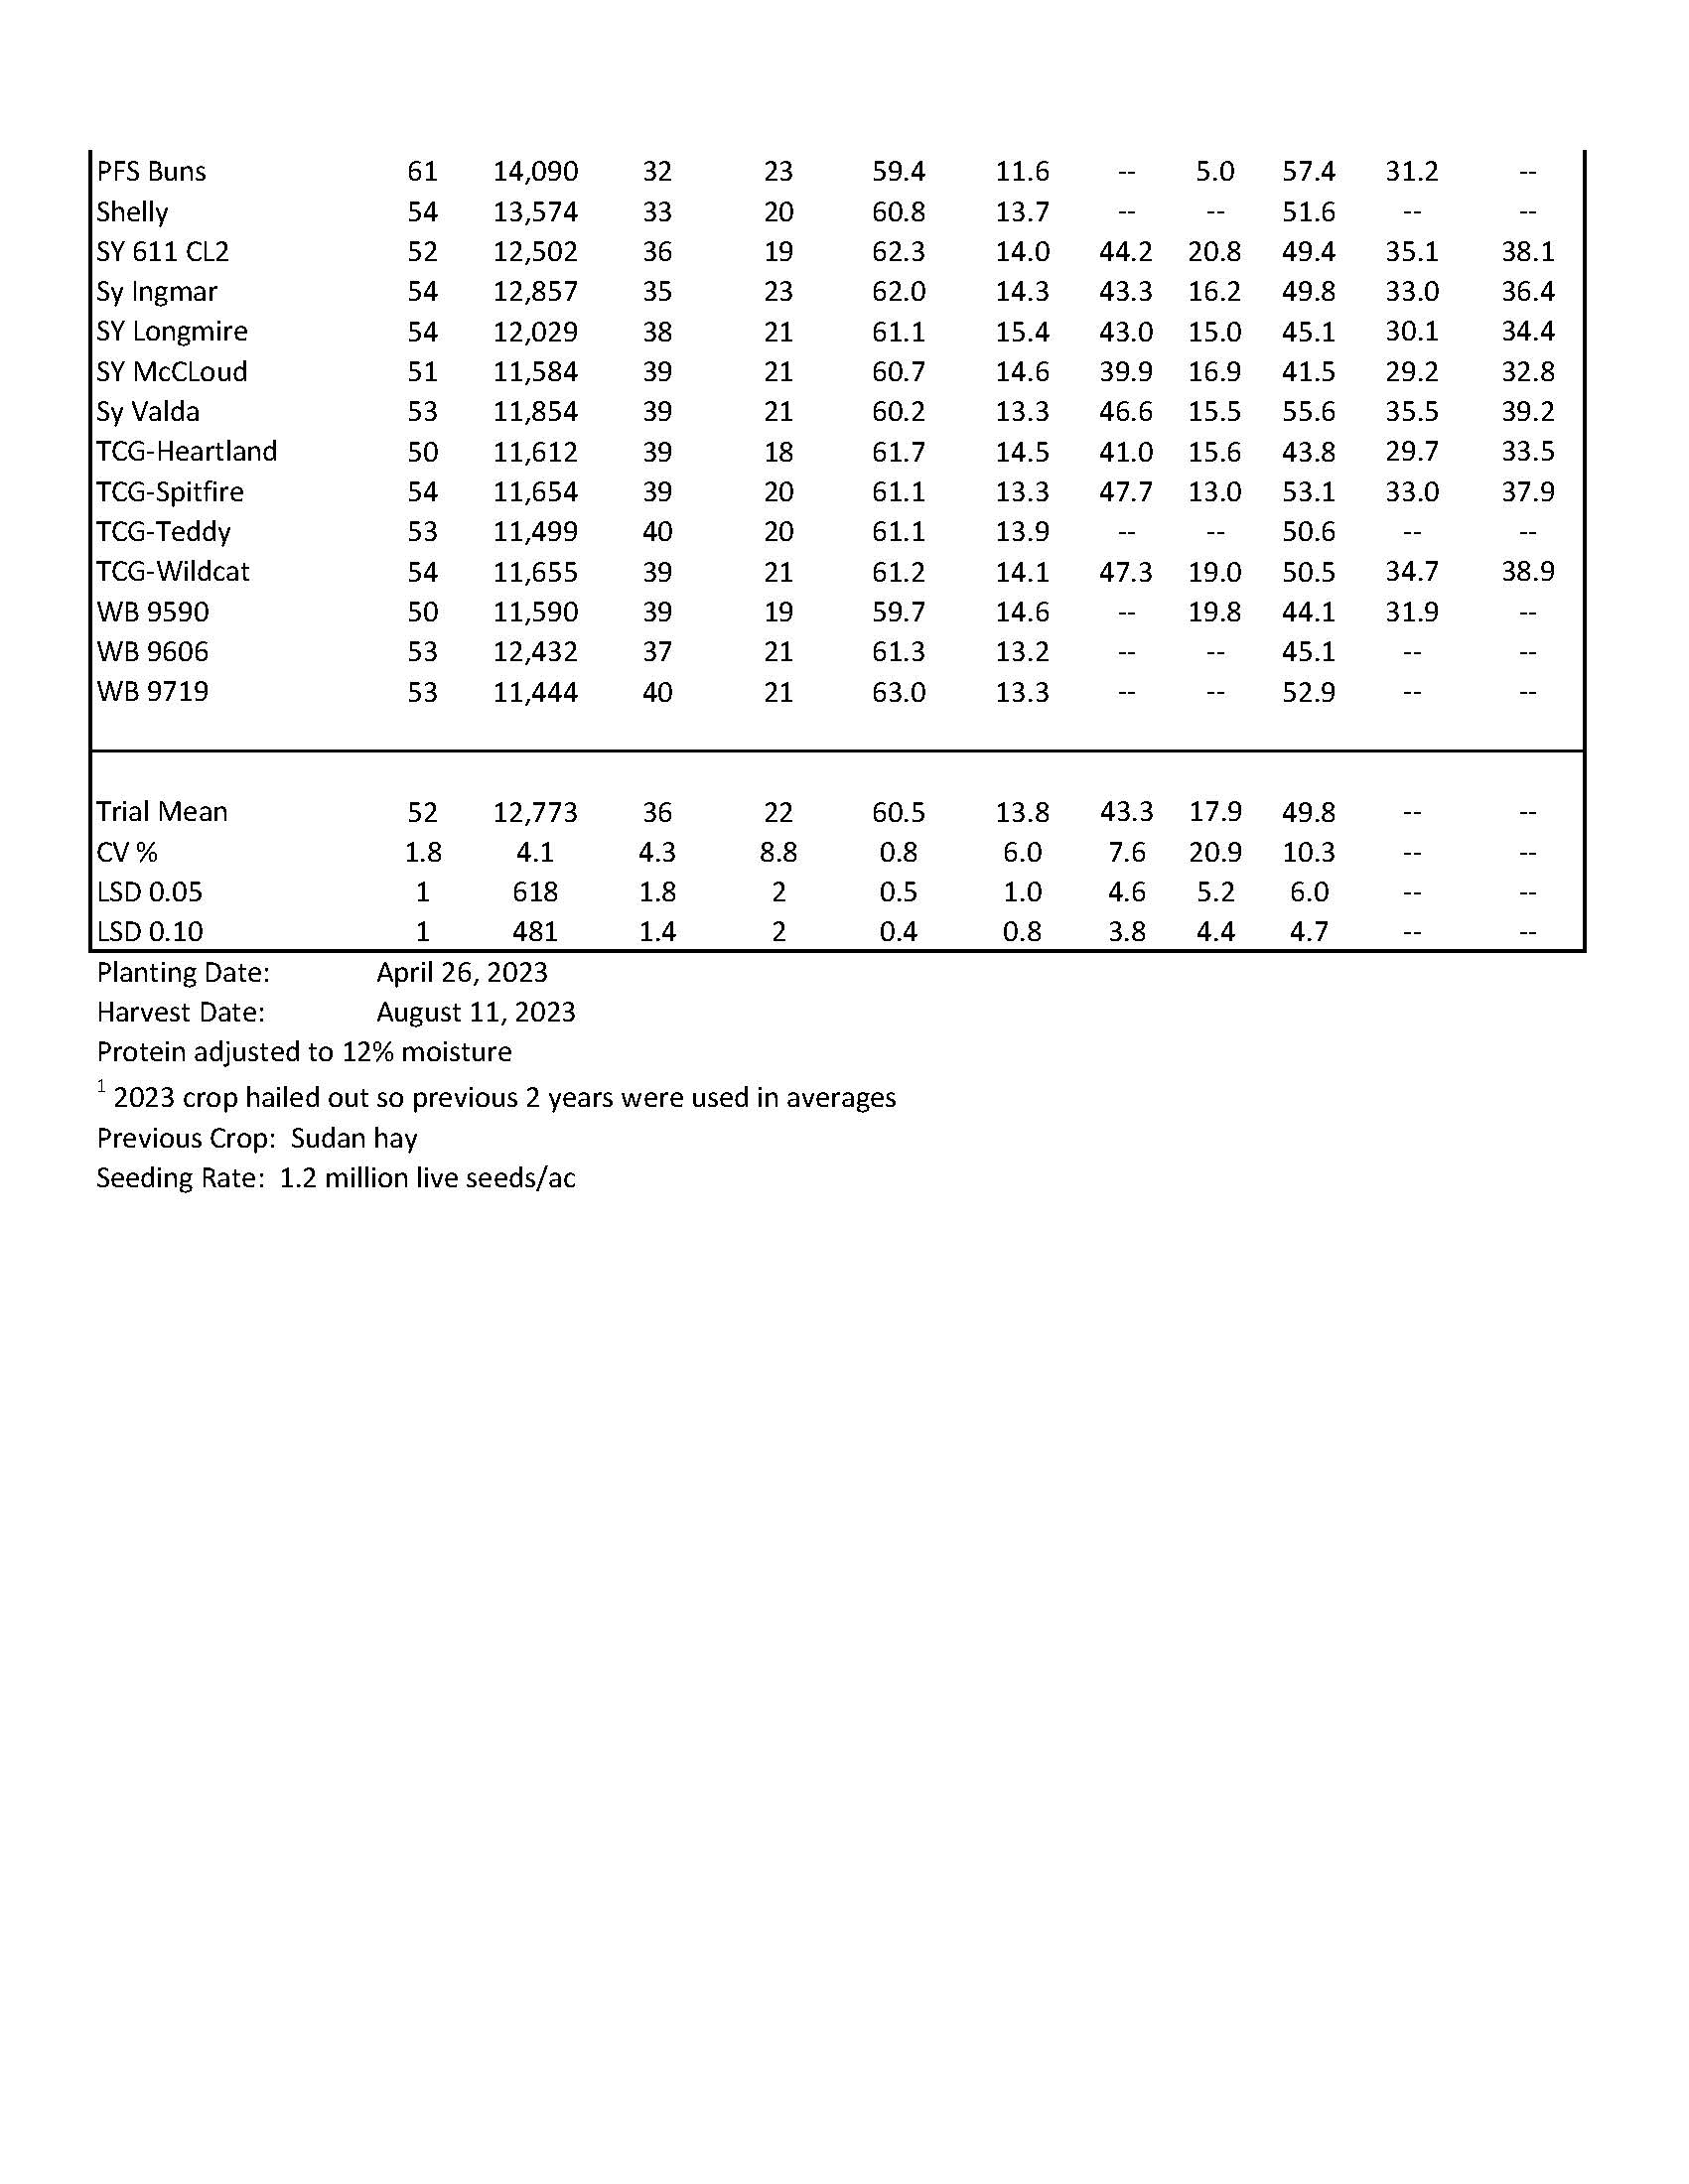
| Spring Wheat | 10-11 |
| Grassland Research | |
| Biological Effects from Drought on Perennial Grasses of the Northern Mixed Grass Prairie | 12 |
| Degraded Grasslands Grazed at 94% and 70% Stocking Rate | 21 |
| Low Herbage Production Caused by Traditional Grazing Practices Can Be Corrected | 31 |
| Increasing Organic Carbon in Northern Plains Grassland Soils | 35 |
| Range Plant Growth Related to Climatic Factors of Western North Dakota, 1982-2023 | 41 |
| Agronomy Research | |
| Surface Applied Lime Impacts on North Dakota No-till Soils | 63 |
| Soil Test 0-3 Inches to Pinpoint Acidity Acres | 65 |
| Phosphorus Fertilizer Impacts on Soybean Yield | 67 |
| Sulfate Fertility Impacts on Canola Grown in Southwest North Dakota | 68 |
| Sulfate Fertilizer Impacts on Wheat Yield | 71 |
| Livestock Research | |
| Integrated Systems Single Timed-AI Heifer Development and Non-Pregnant Heifer Finishing Profitability | 72 |
| Practical Use of Legume Crops in Diverse Crop Rotations | 76 |
| Abstract | 80 |
| Douglas Landblom-Publications and Invited Speaker Presentations | 81 |
| Beef Cattle Producer Synchronized Fixed-Time AI Survey | 82 |
| DREC Outreach | |
| Outreach List 2022 | 84 |
| 2022 Outreach List for DREC | 88 |
| 2022 Weekly Updates | 89 |
| Weather Summary | 91 |
Grassland Research
Biological Effects from Drought on Perennial Grasses of the Northern Mixed Grass Prairie
Llewellyn L. Manske PhD Scientist of Rangeland Research North Dakota State University
Dickinson Research Extension Center Report DREC 23-1200
Drought conditions have been an abiotic environmental factor on grasslands since their beginning. Periods with rainfall shortage are normal weather conditions for Northern Plains Grasslands. Droughts have reoccurred at irregular intervals during 15% of the past 131 growing seasons, 1892 to 2022, in the mixed grass prairie. Droughts can create serious forage deficiency problems for livestock producers if some mitigating preparations have not been performed. Drought growing seasons do not have to be repeating disasters.
Frequency of Water Deficiency
Long-term precipitation records for 131 years (1892-2022) for western North Dakota show that the 6 month perennial plant growing season, mid April to mid October, rarely has adequate rainfall during each month. Only 6% of the growing seasons on record have occurred without water deficiency, that amounts to only 3 growing seasons that did not have water problems in a 50 year period (Manske 2011a, 2023a).
The typical 6 month perennial plant growing season has an average of 2 months, or 32% of the period has water deficiency as determined by the ombrothermic graph technique reported by Emberger et al. (1963). Two months with water deficiency should be considered as the normal perennial plant growing season for the Northern Plains. The frequency of water deficiency occurrence is not distributed evenly across the growing season months. Frequency of water deficiency has occurred 15% in April, 14% in May, 10% in June, 37% in July, 50% in August, 50% in September, and 46% in October (table 1). Water deficiency occurs frequently during growing season months on the mixed grass prairie because the evapotranspiration demand is commonly greater than the amount of precipitation received.
Normal and Wet Growing Seasons
Normal rainfall for an area is between 125% and 75% of the long-term mean (LTM). In western North Dakota, normal rainfall has occurred during 67% of the past 131 growing seasons (table 2). Rainfall greater than 125% of LTM (wet) has occurred during 18% of the growing seasons (table 2). The greatest growing season rainfall was 225% of LTM during 1941 (Manske 2011a). Most, 85%, of the past 131 growing seasons have received rainfall at 75% or greater of LTM (table 2).
Frequency of Droughts
Drought conditions have occurred during 15% of the past 131 growing seasons in western North Dakota and received rainfall at less than 75% of LTM, which is a rate of about 2 drought growing seasons every 13 years. Most of the growing seasons with drought conditions are considered to be moderate, with precipitation at less than 75% but greater than 50% of LTM. Moderate drought conditions have occurred uring 12% of the growing seasons (table 2), at a rate of about 1 moderate drought every 8 years.
Severe droughts are usually wide spread and have occurred during 3% of the past 131 growing seasons in western North Dakota (table 2). The rainfall received is at less than 50% of LTM, and have occurred at a rate of about 1 severe drought every 29 years. Western North Dakota has experienced severe droughts during 1919, 1934, 1936, and 1988. With 1936 the most severe, receiving only 29% of LTM (Manske 2011a).
Physiological Effects from Water Stress on Grasses
Water received as precipitation is essential for the maintenance of the rigidity of plant tissue and for cell enlargement and growth in grass plants (Brown 1995). The physiological and ecological status of grass plants is determined by the balance between rainfall and evapotranspiration. The higher the soil temperature, the greater the evapotranspiration demand. Increased grass tiller density and greater litter cover can lower soil temperature. Poor management reduces soil water holding capacity, and during the long periods between rain events, the amount of soil water decreases below the potential evapotranspiration demand resulting in a water deficiency (table 1) in which plants are unable to absorb adequate quantities of water to match the transpiration rate of water loss putting the grass plants in water stress.
According to Brown (1995), early stages of water stress slow shoot and leaf growth. Leaves show signs of wilting, folding and discoloration. Tillering and new shoot development decrease. Root production may increase during the initial stages. Senescence of older leaves accelerates. Rates of cell wall formation, cell division, and protein synthesis decreases. As water stress increases, enzyme activity declines and the formation of necessary compounds slows or ceases. The stomata begin to close; this reaction results in decreased rates of transpiration and photosynthesis. Rates of respiration and translocation decrease substantially with increases in water stress. When water stress becomes severe, most functions nearly or completely cease and serious damage occurs. Leaf and root mortality induced by water stress progresses from the tips to the crown. The rate of leaf and root mortality increases with increasing stress. Water stress can increase to a point that is lethal, resulting in damage from which the plant cannot recover. Plant death occurs when meristems become so dehydrated that cells cannot maintain cell turgidity and biochemical activity.
Perennial grass plants have only rudimentary processes to slow the rate of decline from water stress. Perennial grass plants have not developed drought defense mechanisms, like complete summer dormancy as resistance to insufficient available soil water.
Drought is Not Just Low Rainfall
The precipitation shortage during drought conditions is generally assumed to be the sole cause for the reduction in herbage production and for the accompanying calamities. Because rainfall cannot be increased on demand, it is commonly presumed that nothing can be done ahead of a drought to mitigate the detrimental impacts. Consequently, it is usually concluded that there is no other recourse than to improvise high-cost, makeshift, emergency schemes to get through the climatic hard times. Despite these common assumptions, by implementation of simple management practices that are designed to increase the quantity of mineral nitrogen above 100 lbs/ac, improve grassland ecosystem health, and to fully activate the biological and ecological processes and mechanisms; drought conditions do not have to be reoccurring disasters.
Low rainfall is the most obvious detrimental factor. However, the additional factors of higher soil temperature and greater soil evapotranspiration rates, deteriorating soil structure, decreasing soil organism activity, reduced grass plant size and density, and reduction of ecosystem health status, also negatively affect forage production. If the reduction in the quantity of rainfall were the only factor causing decreased forage production, the percent reduction in forage below normal levels would be the same percentage as the reduction in precipitation.
Forage production on grasslands managed with traditional or gimmicky grazing management practices is usually reduced by more than double the percent reduction in precipitation. The other most important cause for reduction in forage production greater than the percent reduction in precipitation is the low quantity of available mineral nitrogen in the soil.
Wight and Black (1972) were able to determine that the minimum quantity of 100 lbs of available mineral nitrogen per acre was required in order to sustain forage production at the biological potential level for grasslands in the Northern Plains.
Manske (2009a, 2010a, b, 2011b) found that two of the major internal grass growth mechanisms; the compensatory physiological processes that facilitate the replacement of defoliated leaf and stem biomass, and the asexual processes of vegetative reproduction that produce secondary tillers from axillary buds, also required 100 lbs/ac of available mineral nitrogen to be functionally activated.
Problems from Low Mineral Nitrogen
The inhibitory deficiencies of low mineral nitrogen on grasslands managed with traditional practices are notorious for causing the observed low herbage production (Goetz et al. 1978) during normal precipitation growing season. Wight and Black (1979) found that grasslands that had less than 100 lbs of available mineral nitrogen negatively affected the grass water use efficiency mechanisms and caused the weight of herbage produced per inch of precipitation received to be reduced an average of 49.6% below the weight of herbage produced per inch of precipitation on grassland ecosystems that had 100 lbs/ac or greater of available mineral nitrogen.
Reductions in mineral nitrogen limit herbage production more often than deficient water in temperate grasslands (Tilman 1990). Traditionally managed grasslands have below normal (<100lbs/ac) available mineral nitrogen during the entire growing season (table 3) and cause reduced herbage production even during nondrought growing seasons. During drought conditions, both low mineral nitrogen and low soil water are major contributing factors causing the rate of reduced herbage production to be greater than the percentage of reduction in rainfall, usually greater than double the loss of precipitation.
Intact (never plowed) grassland soils in the Northern Plains are not deficient in nitrogen. Grassland soils contain between 3 to 8 tons, with most grasslands at 5 to 6 tons of organic nitrogen per acre. Application of supplemental nitrogen fertilizer or interseeding of alfalfa are never needed on intact grasslands (Manske 2018).
Organic nitrogen, however, is not available for autotrophic plant growth. Plants can use only inorganic nitrogen. The organic nitrogen must be transformed into mineral nitrogen by soil microbes. The problem of low quantities of available mineral nitrogen in traditionally managed grasslands is actually a deficiency in the biomass of rhizosphere microbes. This deficiency in biomass of soil microbes exists in grasslands because the microbes require an external source of short chain carbon energy. The microflora trophic level (bacteria and fungi) are achlorophyllous and cannot capture their own carbon energy. In addition, grass plant natural carbohydrate leakage from their roots is very low (Manske 2011b).
A second problem in acquiring carbon energy from an external source is that perennial grasses do not store surplus carbohydrates like most other plants but slowly burn the surplus quantities during night respiration. The exception is that grasses do store carbohydrates during the winter hardening period of mid August to hard frost for use during the winter dormancy inactive period. A serious problem of winter kill occurs on grasslands with low health or heavily fall grazed grasses because August and September have both experienced water deficiency conditions during 25% of the past 131 growing seasons (Manske 2011a, 2023a).
The only large source of surplus fixed carbohydrates in native grasslands is in the second year grass lead tillers at vegetative growth stages between the 3.5 new leaf stage and the flower stage during 1 June to 15 July. Transference of these surplus carbohydrates from the grass lead tillers into the rhizosphere zone surrounding the grass roots must occur by intentional management of the exudation process that can be activated by partial defoliation by grazing graminivores that remove only 25% to 33% of the aboveground grass tiller biomass during vegetative growth stages (Manske 2018). The availability of this external short chain carbon energy in the rhizosphere permits the microbes to increase in biomass and activity. It usually requires three growing seasons after a biologically effective twice-over rotation grazing strategy has been implemented in order to build the rhizosphere microbe biomass to around 216 kg/m3 (964 tons/ac) which is large enough to transform 100 lbs/ac of mineral nitrogen (Manske 2023b).
Recovery Rate After Droughts
Recovery of grasslands following the severe drought conditions of 1936, that had growing season precipitation at less than 50% of LTM, required 4 years with greatly reduced stocking rates for heavily stocked traditional grazing practices that had low health conditions, and it required 2 years with reduced stocking rates for moderately stocked traditional grazing practices that had moderately healthy conditions (Whitman et al. 1943). Recovery of grasslands following the severe drought conditions of 1988, that had growing season precipitation at less than 50% of LTM, required less than 1 year with very little reduction in stocking rates for the biological effective twice-over rotation grazing strategy (Manske 1989, 1990).
Recovery of grasslands following moderate drought conditions, that had growing season precipitation at greater than 50% but less than 85% of LTM, required 1 year with reduced stocking rates for moderately stocked 6.0 m and 4.5 m seasonlong grazing practices that had moderately healthy conditions (table 3). Recovery of grasslands following moderate drought conditions, required less than 1 growing season with no reduction in stocking rates for the twice-over rotation grazing strategy that had healthy conditions (table 3).
Grasslands can be Mitigated for Drought
After the twice-over rotation strategy has been implemented and the rhizosphere microbe biomass have built up to be able to transform 100 lbs/ac of mineral nitrogen and the ecosystem is functioning at a healthy condition, the carrying capacity of the grassland will convert to 140% of the seasoning stocking rate. Grasslands managed with the twice-over system can dependably carry this higher stocking rate during normal, wet, and moderate drought, which is 97% of the growing seasons.
Worrying about having enough summer forage for the cow herd is a thing of the past. The disruptive flexible stocking rate contrivance can be permanently eliminated from grazing plans. Stocked at 140% of the seasonlong rate, the grassland ecosystem will continue to improve during normal and wet growing seasons. Depending on the degree of dryness during the moderate drought growing seasons, the ecosystem may regress, but will fully recover the following season. About 3% of the growing seasons have severe drought conditions. The twice-over system has only experienced severe drought one time during 1988. We ended the grazing season a little early that year and fed hay, but were fully stocked the following year. The availability of 100 lbs/ac or greater mineral nitrogen transformed by a large biomass of rhizosphere microbes is the primary factor that permits the increased stocking rate and the ecosystems resistance to reduced rainfall periods (Manske 2018).
Hayfields are Not Mitigated for Drought
Multigenerational livestock agricultural families have experienced moderate and severe drought growing seasons. It is inevitable that during low rainfall growing seasons there will be a shortage of hay. Perennial domesticated grass hayfields have low soil microbe biomass. Alfalfa hayfields require high soil water in order for the rhizobium to function effectively. Both types of hayfields are not grazed at proper phenological growth stages and will have reduced production during moderate drought growing seasons and almost no production during severe drought growing seasons. Normal and wet growing seasons occur during 85% of the growing seasons to prepare a reserved hay supply for 15% of the growing seasons with low precipitation (table 2). Baled hay that has moisture will degrade anytime that it is not frozen. Baled hay older than 1 year will be too low in nutrients. About 10% to 12% of the hay forage produced during normal or wet growing seasons should be ensilaged or dehydrated into pellets and stored until needed during low precipitation years. With this reserve of preserved stored hay, it should be possible to maintain the good genetics in the cow herd intact without much increased expenses. At least, at much less cost than to purchase and ship hay from a distance during every moderate or severe drought growing season.
Drought Mitigation Strategy
The biologically effective twice-over rotation grazing strategy coordinates partial defoliation grazing events with grass phenological growth stages to activate the internal grass growth processes and the ecosystem biogeochemical processes (Manske 2018). The twice-over system improves the health status of grassland ecosystems increasing the ecosystems resistance to drought conditions. The increased rhizosphere organism biomass and activity increases the quantity of available mineral nitrogen above the 100 lbs/ac threshold. The four major internal grass growth mechanisms and the ecosystem biogeochemical processes perform at full functionality. The increased ectomycorrhizal fungi in the rhizosphere improve the structure of the soil by increasing the quantity and depth of aggregations which increases the quantity of water infiltration and increases the water holding capacity of the soil. The increased grass tiller density and increased litter cover shade the soil, lowering the soil temperature and decreasing the rate of soil water loss through evapotranspiration (Manske 2011b). During growing seasons with drought conditions, grasslands with 100 lbs/ac or greater available mineral nitrogen maintain better health conditions which reduce the severity of the detrimental impacts caused by the reduced rainfall resulting in less reduction in the herbage biomass production than on grasslands with moderate or low health conditions and high incurred economic costs caused by traditional grazing practices that have mineral nitrogen available at less than 100 lbs/ac (table 3).
Grasslands of the Northern Plains can be mitigated for drought conditions by implementing grazing management that causes the vegetative grass lead tillers to exudate their surplus carbohydrates during 1 June to 15 July into the rhizosphere that increases the microbe biomass to be able to transform organic nitrogen into 100 lbs/ac or greater of mineral nitrogen which than enable the four major grass growth mechanisms to be activated and the ecosystem biogeochemical processes to function at biologically potential levels that can then mitigate the detrimental effects from drought conditions.
| Table 1. Periodicity of number and percent frequency of water deficiency occurring during perennial plant growing season months, 1892-2022. | ||||
|---|---|---|---|---|
| April | May | June | July | |
| Number | 19 | 18 | 13 | 48 |
| Percent | 15 | 14 | 10 | 37 |
| Table 2. Number and percentage of growing seasons in four major categories of quantity of precipitation received in relation to LTM for 131 growing seasons, 1892-2022, western North Dakota. | ||||
|---|---|---|---|---|
| Severe Drought | Moderate Drought | Normal | Wet | |
| <50% of LTM | >50-<75% of LTM | >75%-<125% of LTM | >125% of LTM | |
| Number | 4 | 15 | 88 | 24 |
| Percent | 3 | 12 | 67 | 18 |
| Six month perennial plant growing season LTM precipitation is 14.5 inches | ||||
| Table 3. Grazing treatment effects on quantity of mineral nitrogen available. |
|---|
| Healthy Status |
| Management Treatment |
| Low Health Grassland |
| <50 lbs N/ac |
| Long-term Deferred |
| Long-term Seasonlong, Sandy soil |
| Long-term Seasonlong, Shallow soil |
| Long-term Seasonlong, Silty soil |
| Moderately Healthy Grassland 50-75 lbs N/ac |
| Long-term Seasonlong, Overflow soil |
| Moderate Traditional |
| Moderate 6.0 m Seasonlong, Silty soil |
| Moderate 4.5 m Seasonlong, Silty soil |
| Healthy Grassland |
| >100 lbs N/ac |
Literature CitedBrown, R.W. 1995. The water relations of range plants: adaptations to water deficits. pg 291-413. in D.J. Bedunah and R.E. Sosebee (eds.). Wildland plants: physiological ecology and developmental morphology. Society for Range Management. Denver, CO. Emberger, C., H. Gaussen, M. Kassas, and A. dePhilippis. 1963. Bioclimatic map of the Mediterranean Zone, explanatory notes. UNESCO-FAO. Paris. 58p. Goetz, H., P.E. Nyren, and D.E. Williams. 1978. Implications of fertilizers in plant community dynamics of Northern Great Plains rangelands. Proceedings of the First International Rangeland Congress. p.671-674. Manske, L.L. 1989. The drought of the 1980's compared to the drought of the 1930's and grazing management recommendations. NDSU Extension Service. Video Tape Presentation. Fargo, ND. Manske, L.L. 1990. North Dakota rangeland changes similar to 1930’s. NDSU Extension Service News Release. February. Fargo, ND. 3p. Manske, L.L. 2009a. Grass plant responses to defoliation. NDSU Dickinson Research Extension Center. Range Research Report DREC 09-1074. Dickinson, ND. 47p. Manske, L.L. 2009b. Enhancement of the nitrogen cycle improves native rangeland. NDSU Dickinson Research Extension Center. Summary Range Management Report DREC 09-3054. Dickinson, ND. 6p. Manske, L.L. 2010a. Leaf stage development of western wheatgrass tillers. NDSU Dickinson Research Extension Center. Range Research Report DREC 10-1075. Dickinson, ND. 48p. Manske, L.L. 2010b. Evaluation of the defoliation resistance mechanisms influence on vegetative tiller initiation and tiller density. NDSU Dickinson Research Extension Center. Range Research Report DREC 10-1076. Dickinson, ND. 13p. Manske, L.L. 2011a. Environmental factors to consider during planning of management for range plants in the Dickinson, North Dakota, region, 1892-2010. NDSU Dickinson Research Extension Center. Range Research Report DREC 11-1018n. Dickinson, ND. 40p. Manske, L.L. 2011b. Biology of defoliation by grazing. NDSU Dickinson Research Extension Center. Range Management Report DREC 11-1067b. Dickinson, ND. 25p. Manske, L.L., and S.A. Schneider. 2013. Effects from long-term nongrazing after 75 years. NDSU Dickinson Research Extension Center. Rangeland Research Outreach Program DREC 13-4016a. Dickinson, ND. 85p. Manske, L.L. 2018. Restoring degraded grasslands. pp. 325-351. in A. Marshall, and R. Collins (ed.). Improving grassland and pasture management in temperate agriculture. Burleigh Dodds Science Publishing. Cambridge, UK. Manske, L.L. 2023a. Range plant growth related to climatic factors of western North Dakota, 1982-2022. NDSU Dickinson Research Extension Center. Range Research Report DREC 23-1078l. Dickinson, ND. 22p. Manske, L.L. 2023b. Low herbage production caused by traditional grazing practices can be corrected. NDSU Dickinson Research Extension Center. Summary Range Management Report DREC 23-3100. Dickinson, ND. 4p. Tilman, D. 1990. Constraints and tradeoffs: towards a predictive theory of competition and succession. Oikos 58:3-15. Whitman, W., H.C. Hanson, and R. Peterson. 1943. Relations of drought and grazing to North Dakota range lands. North Dakota Agricultural Experiment Station Bulletin 320. Fargo, ND. 29p. Wight, J.R., and A.L. Black. 1972. Energy fixation and precipitation use efficiency in a fertilized rangeland ecosystem of the Northern Great Plains. Journal of Range Management 25:376-380. Wight, J.R., and A.L. Black. 1979. Range fertilization: plant response and water use. Journal of Range Management 32:345-349.
|
Degraded Grasslands Grazed at 94% and 70% Stocking Rate
Llewellyn L. Manske PhD
Scientist of Rangeland Research
North Dakota State University
Dickinson Research Extension Center
Report DREC 23-1201
Most North American grasslands are at some level of degradation. Livestock grazing of grasslands is not the cause of ecosystem degradation. The use of traditional and gimmicky grazing management practices that do not meet the biological requirements of the grass plants and the soil microorganisms is the factor that can cause grassland ecosystem degradation. The twice-over rotation grazing strategy is designed to coordinate partial grazing defoliation events with grass phenological growth stages in order to meet the biological requirements of the grass plants and soil microbes and activate the four internal grass growth mechanisms and the ecosystem biogeochemical processes that increase the available mineral nitrogen to 100 lbs/ac or greater which are necessary for full functionality of grassland ecosystems, and it has the ability to restore degraded grassland ecosystems (Manske 2021). However, in order for this practice to work effectively, grazing graminivores must remove 25% to 33% of the aboveground leaf and stem biomass by partial defoliation between the three and a half new leaf stage and the flower stage which occurs each year between 1 June and 15 July (Manske 2018b).
Study Area
The study area was 1,988 acres (804.5 hectares) of mixed grass prairie on the BLM recreation area located in eastern Stark country, western North Dakota. The area was a working cattle ranch prior to 1993. For 13 years, between 1993 and 2005, cattle grazing was not permitted. As a result of this long-term nondefoliation management by complete rest, the biological requirements of the native plants and soil microorganisms were not met. Grass plants produced double the herbage biomass than needed for photosynthesis (Coyne et al. 1995), when this surplus herbage was not removed by annual grazing, the standing dead and litter built up rapidly. The standing dead shaded the lower leaves and greatly reduced the rate of photosynthesis, reducing carbohydrate supply, causing reduced growth rates of leaves and roots. Increased litter develops into a thick mulch layer that reduces water infiltration, prevents accession of organic nutrients to the soil, and modifies soil temperatures (Manske 2020). These problems result in greatly reduced native plant density which creates large open spaces for invasion by introduced plants that can exist under low light conditions (Peltzer and Kochy 2001). The largest increase was Kentucky bluegrass. Kentucky bluegrass basal cover changed from 0.0% to 12.35% in 13 years of nondefoliation producing 1684.81 lbs/ac of herbage before this grazing study started in the spring of 2006.
Precipitation
Perennial plant growing season (mid April to mid October) precipitation was low at a moderate drought during 2006 and 2007, low normal during 2008 to 2010, and high normal during 2011. Precipitation was low normal during 2018, high during 2019, low at a moderate drought during 2020, and normal during 2021 and 2022.
Management
This project was developed to test and evaluate the use of the biologically effective grazing management strategy in the restoration of degraded mixed grass prairie plant species herbage biomass and basal cover. A three-pasture twice-over rotation grazing management system was implemented with each pasture grazed two periods per growing season. Each of the three pastures in the rotation was grazed for 14 to 16 days during the first period, the 45-day interval from 1 June to 15 July. The length of the first period on each pasture is the same percentage of 45 days as the percentage of the total season’s grazeable forage each pasture contributes. During the second period, the 90-day interval from 15 July to 14 October, each pasture was grazed for double the number of days it was grazed during the first period (Manske 2018a). A fourth pasture was not grazed and was considered to be the control treatment.
Stocking rate assessment used current Ecological Site Maps to determine the AUM’s/ac for the three grazed pastures with a total of 648 AUM’s available. With a grazing season of 4.5 months, the stocking rate of the three pasture system had a total of 144 AU’s and a cow herd weight of 144,031 lbs. During the grazing seasons of 2006 to 2011, the mean cow herd weight of 136,095 lbs grazed the three pastures at a 94% stocking rate. During the grazing seasons of 2018 to 2022, the reduced mean cow herd weight of 100,822 lbs grazed the three pastures at a 70% stocking rate.
Permanent plots organized in a paired-plot design (equal areas of grazed and ungrazed at each site) were developed as plant sample sites. A 16’ X 32’ stock panel exclosure that prevented livestock access and an adjacent area of equal size accessibility by livestock were used for the nondestructive sampling (ten-pin point frame) on silty ecological sites in each of the four pastures. An additional area of similar size accessible by livestock was established at each silty site for destructive data collection (herbage biomass clipping).
Vegetation Sampling Methods
During the grazing season, aboveground live and dead herbage biomass was collected monthly; May through October, by the standard clipping method (Cook and Stubbendieck 1986). The herbage material from five 0.25 m2 quadrats (frames) at each sample site was sorted in the field by biotype categories: domesticated grasses, native grasses, upland sedges, and forbs, along with the dead categories of standing dead and litter. The herbage of each biotype category from each frame was placed in labeled paper bags of known weight, oven dried at 140° F (60° C), and weighed to determine herbage biomass in lbs/ac.
Plant species composition was determined during peak growth, during July and August, by the ten-pin point frame method (Cook and Stubbendieck 1986), with 2000 points collected along permanent transect segments both inside (ungrazed) and outside (grazed) combined each exclosure to determine percent (%) basal cover for each plant species and then similar species were combined into biotype categories.
Results
Most of the mean total live herbage biomass during 2006 to 2011 was composed of domesticated grass at 82.4% on the nongrazed control treatment (table 1) and at 50.9% on the twice-over treatment (table 3). Most of the mean total live herbage biomass during 2018 to 2022 was composed of domesticated grass at 77.9% on the nongrazed control treatment (table 2) and at 81.0% on the twice-over treatment (table 4).
The mean domesticated grass herbage biomass on the nongrazed control treatment was 1754.60 lbs/ac (table 1). The twice-over treatment grazed at 94% stocking rate caused the mean domesticated grass herbage biomass to decrease 51.7% to 847.25 lbs/ac (table 3), and later the twice-over treatment grazed at 70% stocking rate caused the mean domesticated grass herbage biomass to increase 119.4% to 1858.45 lbs/ac (table 4).
The mean domesticated grass basal cover on the nongrazed control treatment was 16.29% (table 7). The twice-over treatment grazed at 94% stocking rate caused the basal cover to decrease 65.0% to 5.70% (table 9), and later the twice-over treatment grazed at 70% stocking rate caused the basal cover to increase 272.6% to 21.24% (table 10).
The domesticated grass biotype category was composed of mostly Kentucky bluegrass and small amounts of smooth brome and crested wheat. During 2006 to 2011, the domesticated grass biotype category on the nongrazed control treatment was composed of 99.93% Kentucky bluegrass, 0.07% smooth brome, and 0.0% crested wheat (table 5) and on the twice-over treatment grazed at 94% stocking rate was composed of 96.74% Kentucky bluegrass, 1.26% smooth brome, and 1.99% crested wheat (table 5).
During the 2018 to 2022, the domesticated grass biotype category on the nongrazed control treatment was composed of 94.47% Kentucky bluegrass, 5.53% smooth brome, and 0.0% crested wheat (table 6) and on the twice-over treatment grazed at 70% stocking rate was composed of 81.56% Kentucky bluegrass, 12.74% smooth brome, and 5.70% crested wheat (table 6).
The mean Kentucky bluegrass herbage biomass on the nongrazed control treatment was 1753.32 lbs/ac (table 5). The twice-over treatment grazed at 94% stocking rate caused the Kentucky bluegrass biomass to decrease 53.3% to 819.65 lbs/ac (table 5), and later the twice-over treatment grazed at 70% stocking rate caused the Kentucky bluegrass herbage to increase 84.9% to 1515.74 lbs/ac (table 6).
The mean Kentucky bluegrass basal cover on the nongrazed control treatment was 16.28%. The twice-over treatment grazed at 94% stocking rate caused the Kentucky bluegrass basal cover to decrease 66.0% to 5.54%, and later the twice-over treatment grazed at 70% stocking rate caused the Kentucky bluegrass basal cover to increase 211.4% to 17.25%.
The twice-over treatment grazed at 94% stocking rate for six growing seasons reduced Kentucky bluegrass herbage biomass 53.3% to 819.65 lbs/ac and reduced the basal cover 66.0% to 5.54% basal cover. At this level, the grassland was not a fully restored functional ecosystem. The twice-over treatment grazed at 94% stocking rate was progressively improving the grassland ecosystem and should have continued for another four to five years to further reduce the Kentucky bluegrass herbage biomass and basal cover.
The reduction of the Kentucky bluegrass was not caused by severe grazing to remove large quantities of bluegrass plant material. Kentucky bluegrass has a long history of being grazed short and has developed highly effective grazing defense mechanisms which are slightly better than the grazing defense mechanisms developed by the native grasses of the northern plains. However, there are two mechanisms that are better in the native grasses than in Kentucky bluegrass. These are the nutrient resource uptake and the water use efficiency mechanisms. The reduction in the Kentucky bluegrass was caused by the increase in the native grass quantity and the improvement in effectiveness of these two mechanisms that out competed the Kentucky bluegrass for soil nutrients and better water use efficiency causing a deficiency of soil nutrients and soil water available to the Kentucky bluegrass plants causing the reductions.
Unfortunately, the land owner considered that we had too many cattle that were impeding multi use quality and restricting wildlife use resulting in a stocking rate reduction to 70%. The twice-over treatment grazed at 70% stocking rate caused the Kentucky bluegrass herbage biomass to increase 84.9% to 1515.74 lbs/ac (table 6) and the basal cover to increase 211.4% to 17.25% basal cover. At this low stocking rate, the grazing livestock were not able to activate adequate quantities of native grass tiller’s internal grass growth mechanisms and the ecosystem biogeochemical processes by partial defoliation causing increased grassland degradation.
Native grass herbage biomass and basal cover data included both cool and warm season grasses primarily composed of Western wheatgrass, Needle and thread, Green needlegrass, Prairie Junegrass, and Blue grama on the twice-over treatments and Prairie sandreed and Green needlegrass on the nongrazed treatment. The mean native grass herbage biomass on the nongrazed control treatment was 218.57 lbs/ac (table 1). The twice-over treatment grazed at 94% stocking rate caused the mean native grass herbage biomass to increase 72.9% to 377.91 lbs/ac (table 3), and later the twice-over treatment grazed at 70% stocking rate caused the mean native grass herbage biomass to decrease 60.4% to 149.72 lbs/ac (table 4).
The mean native grass basal cover on the nongrazed control treatment was 2.05% (table 7). The twice-over treatment grazed at 94% stocking rate caused the mean native grass basal cover to increase 222.4% to 6.62% (table 9), and later the twice-over treatment grazed at 70% stocking rate caused the mean native grass basal cover to decrease 33.7% to 4.38% (table 10).
The twice-over treatment grazed at 94% stocking rate for six growing seasons increased native grass herbage biomass 72.9% to 377.91 lbs/ac (table 3) and increased basal cover 222.4% to 6.62% (table 9). At this level, the grassland was not a fully functional ecosystem. The twice-over treatment grazed at 94% stocking rate was progressively improving the grassland by increasing the quantity of native grasses. The increase in native grass was just not the increase in herbage biomass and basal cover. The increase also included an increase in the four internal grass growth mechanisms: the compensatory physiological growth, the vegetative reproduction by tillering, the nutrient resource uptake, and the water use efficiency mechanisms. This increase in the grass growth mechanisms was causing the reductions of the plants that had invaded the grassland during the thirteen years of no grazing.
In order for grazing livestock to partially defoliate the native grasses they had to be able to reach them which occurred when the twice-over treatment was grazed at 94% stocking rate because the Kentucky bluegrass had the herbage biomass reduced 53.0% and the basal cover reduced 66.0%. The activation of the four internal grass growth mechanisms requires that 25% to 33% of the native grass lead tiller aboveground herbage biomass be removed by grazing between the three and a half new leaf stage and the flower stage on 60% to 80% of the native grass lead tillers which was accomplished by the twice-over treatment grazed at 94% stocking rate but not by the treatment grazed at 70% stocking rate.
The upland sedge herbage biomass and basal cover data include primarily Threadleaf sedge and a small amount of Sun sedge. The mean upland sedge herbage biomass on the nongrazed control treatment was 26.70 lbs/ac (table 1). The twice-over treatment grazed at 94% stocking rate caused the mean sedge herbage biomass to increase 1018.9% to 298.95 lbs/ac (table 3), and later the twice-over treatment grazed at 70% stocking rate caused the mean sedge herbage biomass to decrease to 34.6% to 195.46 lbs/ac (table 4).
The mean upland sedge basal cover on the nongrazed control treatment was 1.88% (table 7). The twice-over treatment grazed at 94% stocking rate caused the mean sedge basal cover to increase 455.3% to 10.44% (table 9), and later the twice-over treatment grazed at 70% stocking rate caused the mean sedge basal cover to decrease 37.7% to 6.50% (table 10).
The twice-over treatment grazed at 94% stocking rate for six growing seasons increased upland sedge biomass 1018.9% to 298.95 lbs/ac and increased basal cover 455.3% to 10.44%. If the twice-over treatment grazed at 94% stocking rate would have continued past six years, the upland sedge herbage biomass and basal cover would also have continued to increase until the fifteenth growing season. At that time, the native grass increase would have occupied the existing empty spaces of the grass plant community and then the native cool season grasses would have started to out compete the upland sedge causing the sedge to decrease and the cool season grass to continue to increase (Manske 2018b).
The forb herbage biomass and basal cover data include primarily white prairie aster, silverleaf scurfpea, American vetch, and blue wild lettuce. The mean forb herbage biomass on the nongrazed control treatment was 128.77 lbs/ac (table 1). The twice-over treatment grazed at 94% stocking rate caused the mean forb herbage biomass to increase 8.5% to 139.67 lbs/ac (table 3), and later the twice-over treatment grazed at 70% stocking rate caused the mean forb herbage biomass to decrease 34.7% to 91.22 lbs/ac (table 4).
The mean forb basal cover on the nongrazed control treatment was 0.44% (table 7). The twice-over treatment grazed at 94% stocking rate caused the mean forb basal cover to increase 93.2% to 0.85% (table 9), and later the twice-over treatment grazed at 70% stocking rate caused the mean forb basal cover to decrease 58.8% to 0.35% (table 10).
The twice-over treatment grazed at 94% stocking rate for six growing seasons caused small increases in forb herbage biomass of 8.5% to 139.67 lbs/ac and increased basal cover 93.2% to 0.85%. Most perennial forbs are not grazed and produce little direct competition for grasses. Forb roots have little nutrient and water absorption capacity in the upper soil levels. The presence of forbs in grasslands depends more on available open spaces for them to occupy and whether the quantity of precipitation during April, May, and June was above or below the long-term mean.
The twice-over treatment grazed at 94% stocking rate was progressively improving the degraded grassland ecosystem. The twice-over treatment grazed at 94% stocking rate for six grazing seasons decreased Kentucky bluegrass herbage biomass 53.0% to 823.44 lbs/ac and decreased basal cover 66.0% to 5.54%; increased native grass herbage biomass 72.9% to 377.91 lbs/ac and increased basal cover 222.4% to 6.62%; increased upland sedge herbage biomass 1018.9% to 298.95 lbs/ac and increased basal cover 455.3% to 10.44%; and increased forb herbage biomass 8.5% to 139.67 lbs/ac and increased basal cover 93.2% to 0.85%. It would have taken several additional grazing seasons for the twice-over treatment grazed at 94% stocking rate to fully restore this degraded grassland ecosystem. Of the major possible multiple uses of grasslands; watershed, wildlife habitat, recreation, and livestock grazing; grazing livestock is the only use that can be used to restore degraded grasslands (Manske 2020).
Discussion
The twice-over treatment grazed at 70% stocking rate for five growing seasons undid all the beneficial improvements that were accomplished by the twice-over treatment grazed at 94% stocking rate. The twice-over treatment grazed at 70% stocking rate increased Kentucky bluegrass herbage biomass 84.9% to 1515.74 lbs/ac and increased basal cover 211.4% to 17.25%; decreased native grass herbage biomass 60.4% to 149.72 lbs/ac and decreased basal cover 33.7% to 4.38%; decreased upland sedge herbage biomass 34.6% to 195.46 lbs/ac, and decreased basal cover 37.7% to 6.50%; and decreased forb herbage biomass 34.7% to 91.22 lbs/ac and decreased basal cover 58.8% to 0.35% basal cover. This extremely low 70% stocking rate caused further degradation to the grassland ecosystem that increased the quantities of Kentucky bluegrass to be greater than, and decreased the quantities of native grass, upland sedge, and prairie forbs to levels lower than this grassland had at the start of the study in 2006.
Native grass plants produce double the leaf and stem biomass needed for photosynthesis and normal growth and development (Coyne et al. 1995). This 50% portion of the grass weight is expendable by the plant (Crider 1955). The surplus standing leaf material accumulates rapidly and changes from an asset to a detriment if graminivores do not remove it annually by grazing. If not removed, the surplus biomass causes shading that results in ecosystem degradation. When a grassland is managed by the biologically effective twice-over rotation strategy, the surplus carbohydrates produced by vegetative lead tillers are exudated through the roots into the rhizosphere and increase the biomass of the soil microbes. The larger biomass of microbes can then transform organic nitrogen into mineral nitrogen at quantities greater than 100 lbs/ac. When mineral nitrogen is available at 100 lbs/ac or greater, the four internal grass growth mechanisms of compensatory physiological growth, vegetative reproduction by tillering, nutrient resource uptake, and water use efficiency mechanisms can be fully activated and are capable of increasing herbage biomass production above that produced on traditional seasonlong treatments. As the herbage biomass increases, the stocking rate should be increased at 10% per year until the stocking rate is 140% of the seasonlong rate, which, has been the biological potential of the twice-over system in the Northern Plains. The increase in stocking rate must match the increase in grass herbage biomass. Grasslands grazed at low stocking rates below the level of increased herbage biomass develop problems. If the stocking rate remains at 80%-100% of the seasonlong rates and the herbage biomass increases to 140%, the surplus accumulating standing leaf biomass shade the lower leaves, increasing the rate of leaf senescence that reduces the rate of photosynthesis, causing a decrease in the supply of carbohydrates that results in a reduction in growth of leaves and roots (Langer 1972, Briske and Richards 1995). Lack of grazing the increased surplus leaves reduces native grass tiller densities by decreasing vegetative tiller development and increasing tiller mortality through shading (Manske 1999). After a few years, the shading increases, the composition of native grass species reduces, and the composition of shade-tolerant replacement species, like Kentucky bluegrass increases. The only way to prevent this unwanted grass species change from happening is by increasing the stocking rate as the rate of herbage biomass production increases.
Kentucky bluegrass is a commonly used lawn grass, however, it is not a desirable grass to have in a grassland pasture. It requires double the quantity of water per pound of herbage biomass production than native grasses. At any amount of growing season precipitation, Kentucky bluegrass tillers would produce half the herbage biomass of the native grass tillers. Kentucky bluegrass starts spring growth early and provides adequate quality of forage only during the early part of June and then it goes dormant during July and August in the Northern Plains.
It takes several growing seasons, but by implementation of the twice-over rotation grazing strategy grazed at 80% to 100% the seasonlong stocking rate, Kentucky bluegrass can be greatly reduced, and at the same time native grass can be greatly increased by restoring the ecosystem biogeochemical processes and activation of the four internal grass growth mechanisms after increasing the biomass and activity of the rhizosphere microbes by removal of 25% to 33% of the aboveground biomass from 60% to 80% of grass lead tillers with partial defoliation by grazing graminivores between the three and a half new leaf stage and the flower stage which occurs each year during 1 June to 15 July.
The twice-over rotation grazing strategy cannot restore degraded grassland ecosystems instantaneously, it usually requires about three years before the biomass of the rhizosphere microbes has increased sufficiently to transform 100 lbs/ac of mineral nitrogen. With 100 lbs/ac of mineral nitrogen available, the herbage biomass can increase above the quantity of herbage produced on the same soil type managed by traditional seasonlong treatments. The biological potential herbage biomass production in the Northern Plains has consistently been 140% of the seasonlong herbage production. The total live herbage biomass production before this grazing study started in 2006 was 1649.13 lbs/ac. The herbage biomass increased on the twice-over treatment grazed at 94% stocking rate and reached 2309.16 lbs/ac in 2011 which was 140% greater than that before grazing started. The mean total live herbage biomass during 2018 to 2022 was 139% greater than that before grazing started.
This increase in total live herbage biomass is a great benefit on private land because of the increase in livestock production. However, on federal grasslands, this 40% increase in live herbage biomass becomes a problem because the cattle numbers cannot be increased to match the herbage increase. The increased herbage biomass produced on federal grasslands managed with twice-over treatments becomes a detriment by shading the desirable native grasses and permitting shade-tolerant grasses, like Kentucky bluegrass, to increase. Cattle tend not to graze summer dormant Kentucky bluegrass. The increased dead Kentucky bluegrass material build up into a thick mulch that reduces water infiltration, prevents accession of organic nutrients to the soil, and modifies soil temperatures resulting in great reductions of the belowground biogeochemical processes that are necessary for proper functioning of grassland ecosystems. The only biological method to correct this degrading problem is to increase the livestock stocking rate to match the increase in herbage biomass production.
Acknowledgment
I am grateful to Sheri Schneider for assistance in production of this manuscript and for development of the tables. I am grateful to John Urban for assistance in this project for field data collection.
| Table 1. Herbage biomass, lbs/ac, on Nongrazed treatment on silty ecological site, 2006-2011. | |||||||
|---|---|---|---|---|---|---|---|
| Herbage | 2006 | 2007 | 2008 | 2009 | 2010 | 2011 | Mean |
| Domesticated | 1833.85 | 1791.31 | 1320.16 | 1779.62 | 1468.69 | 2333.98 | 1754.6 |
| Native Grass | 132.32 | 236.81 | 142.46 | 304.91 | 283.71 | 211.22 | 218.57 |
| Sedges | 25.91 | 22.27 | 20.29 | 49.44 | 30.48 | 11.82 | 26.7 |
| Forbs | 128.75 | 75.97 | 27.02 | 116.81 | 238.65 | 185.43 | 128.77 |
| Total Live | 2120.83 | 2126.36 | 1509.93 | 2250.78 | 2021.53 | 2742.47 | 2128.65 |
| Table 2. Herbage biomass, lbs/ac, on Nongrazed treatment on silty ecological site, 2018-2022. | ||||||
|---|---|---|---|---|---|---|
| Herbage | 2018 | 2019 | 2020 | 2021 | 2022 | Mean |
| Domesticated | 2114.64 | 2229.41 | 2508.9 | 1835.14 | 1745.95 | 2086.81 |
| Native Grass | 604.19 | 514.39 | 113.59 | 330.64 | 415.67 | 395.7 |
| Sedges | 12.49 | 10.11 | 16.06 | 16.65 | 8.92 | 12.85 |
| Forbs | 162.94 | 228.35 | 180.19 | 231.33 | 107.64 | 182.09 |
| Total Live | 2894.25 | 2982.25 | 2818.72 | 2413.75 | 2278.17 | 2677.43 |
| Table 3. Herbage biomass, lbs/ac, on Twice-over treatment grazed at 94% stocking rate, 2006-2011. | |||||||
|---|---|---|---|---|---|---|---|
| Herbage | 2006 | 2007 | 2008 | 2009 | 2010 | 2011 | Mean |
| Domesticated | 936.07 | 1211.54 | 322.31 | 575.16 | 713.96 | 1324.45 | 847.25 |
| Native Grass | 231.5 | 377.53 | 213.61 | 474.07 | 354.3 | 616.43 | 377.91 |
| Sedges | 272.66 | 260.14 | 275.87 | 407.71 | 315.3 | 262.01 | 298.95 |
| Forbs | 118.05 | 77.64 | 37.11 | 104.19 | 394.74 | 106.27 | 139.67 |
| Total Live | 1558.28 | 1926.85 | 848.9 | 1561.13 | 1778.3 | 2309.16 | 1663.77 |
| Table 4. Herbage biomass, lbs/ac, on Twice-over treatment grazed at 70% stocking rate, 2018-2022. | ||||||
|---|---|---|---|---|---|---|
| Herbage | 2018 | 2019 | 2020 | 2021 | 2022 | Mean |
| Domesticated | 1498.56 | 2218.4 | 1990.65 | 1615.71 | 1968.94 | 1858.45 |
| Native Grass | 188.22 | 205.05 | 123.99 | 111.8 | 119.53 | 149.72 |
| Sedges | 314.58 | 227.7 | 151.34 | 168 | 115.66 | 195.46 |
| Forbs | 73.44 | 101.1 | 115.07 | 78.2 | 88.31 | 91.22 |
| Total Live | 2074.79 | 2752.24 | 2381.05 | 1973.7 | 2292.44 | 2294.84 |
| Table 5. Herbage biomass (lbs/ac) of domesticated grass components for Nongrazed and Twice-over treatments, | |||||||
|---|---|---|---|---|---|---|---|
| 2006 to 2011. | |||||||
| Nongrazed | 2006 | 2007 | 2008 | 2009 | 2010 | 2011 | Mean |
| Kentucky bluegrass | 1833.85 | 1791.31 | 1320.16 | 1779.62 | 1468.69 | 2326.28 | 1753.32 |
| Smooth brome | 0 | 0 | 0 | 0 | 0 | 7.7 | 1.28 |
| Crested wheat | 0 | 0 | 0 | 0 | 0 | 0 | 0 |
| Total | 1833.85 | 1791.31 | 1320.16 | 1779.62 | 1468.69 | 2333.98 | 1754.6 |
| Twice-over | 2006 | 2007 | 2008 | 2009 | 2010 | 2011 | Mean |
| Kentucky bluegrass | 858.1 | 1182.1 | 315.99 | 564.98 | 710.82 | 1285.91 | 819.65 |
| Smooth brome | 0 | 29.44 | 0 | 2.76 | 3.14 | 28.87 | 10.7 |
| Crested wheat | 77.97 | 0 | 6.32 | 7.42 | 0 | 9.67 | 16.9 |
| Total | 936.07 | 1211.54 | 322.31 | 575.16 | 713.96 | 1324.45 | 847.25 |
| Table 6. Herbage biomass (lbs/ac) of domesticated grass components for Nongrazed and Twice-over treatments, | ||||||
|---|---|---|---|---|---|---|
| 2018 to 2022. | ||||||
| Nongrazed | 2018 | 2019 | 2020 | 2021 | 2022 | Mean |
| Kentucky bluegrass | 2075.73 | 2091.86 | 2415.07 | 1713.47 | 1561.23 | 1971.47 |
| Smooth brome | 38.91 | 137.55 | 93.83 | 121.67 | 184.72 | 115.34 |
| Crested wheat | 0 | 0 | 0 | 0 | 0 | 0 |
| Total | 2114.64 | 2229.41 | 2508.9 | 1835.14 | 1745.95 | 2086.81 |
| Twice-over | 2018 | 2019 | 2020 | 2021 | 2022 | Mean |
| Kentucky bluegrass | 1250.25 | 1913.81 | 1664.18 | 1300.16 | 1450.32 | 1515.74 |
| Smooth brome | 166.94 | 222.95 | 202.25 | 208.1 | 383.75 | 236.8 |
| Crested wheat | 81.37 | 81.64 | 124.22 | 107.44 | 134.87 | 105.91 |
| Total | 1498.56 | 2218.4 | 1990.65 | 1615.71 | 1968.94 | 1858.45 |
| Table 7. Basal cover, %, on Nongrazed treatment on silty ecological sites, 2006-2011. | |||||||
|---|---|---|---|---|---|---|---|
| Basal cover | 2006 | 2007 | 2008 | 2009 | 2010 | 2011 | Mean |
| Domesticated | 12.35 | 19.95 | 11.2 | 15.3 | 23.6 | 15.35 | 16.29 |
| Native Grass | 0.9 | 3.1 | 3.95 | 1.25 | 1.9 | 1.2 | 2.05 |
| Sedges | 2 | 2.2 | 1.9 | 2.35 | 1.75 | 1.05 | 1.88 |
| Forbs | 0.8 | 0.3 | 0.1 | 0.1 | 1.15 | 0.2 | 0.44 |
| Total Live | 16.05 | 25.55 | 17.15 | 19 | 28.4 | 17.8 | 20.66 |
| Table 8. Basal cover, %, on Nongrazed treatment on silty ecological site, 2018-2022. | ||||||
|---|---|---|---|---|---|---|
| Basal cover | 2018 | 2019 | 2020 | 2021 | 2022 | Mean |
| Domesticated | 21.7 | 22.7 | 18.7 | 19.6 | 20.8 | 20.7 |
| Native Grass | 3.3 | 2.5 | 2.2 | 0.5 | 1.4 | 1.98 |
| Sedges | 0.2 | 0.1 | 0 | 0.1 | 0.1 | 0.1 |
| Forbs | 0.3 | 0.2 | 0.3 | 0.6 | 0.6 | 0.4 |
| Total Live | 25.5 | 25.5 | 21.2 | 20.8 | 22.9 | 23.18 |
| Table 9. Basal cover, %, on Twice-over treatment grazed at 94% stocking rate, 2006-2011. | |||||||
|---|---|---|---|---|---|---|---|
| Basal cover | 2006 | 2007 | 2008 | 2009 | 2010 | 2011 | Mean |
| Domesticated | 4.8 | 5.36 | 4.08 | 6.2 | 6.88 | 6.88 | 5.7 |
| Native Grass | 2.55 | 8.65 | 6.8 | 7.6 | 7.65 | 6.45 | 6.62 |
| Sedges | 7.75 | 10.83 | 10.75 | 11.05 | 12.7 | 9.55 | 10.44 |
| Forbs | 0.45 | 0.43 | 0.2 | 0.45 | 3.05 | 0.5 | 0.85 |
| Total Live | 15.55 | 25.27 | 21.83 | 25.3 | 30.28 | 23.38 | 23.61 |
| Table 10. Basal cover, %, on Twice-over treatment grazed at 70% stocking ra2018-2022. | ||||||
|---|---|---|---|---|---|---|
| Basal cover | 2018 | 2019 | 2020 | 2021 | 2022 | Mean |
| Domesticated | 17.5 | 20.4 | 21.65 | 23.3 | 23.35 | 21.24 |
| Native Grass | 5.25 | 5 | 4.25 | 3.5 | 3.9 | 4.38 |
| Sedges | 8.85 | 6.6 | 5.7 | 6.45 | 4.9 | 6.5 |
| Forbs | 0.25 | 0.5 | 0.3 | 0.35 | 0.35 | 0.35 |
| Total Live | 31.85 | 32.5 | 31.9 | 33.6 | 32.5 | 32.47 |
Literature Cited
Briske, D.D., and J.H. Richards. 1995. Plant response to defoliation: a physiological, morphological, and demographic evaluation. p. 635-710. in D.J. Bedunah and R.E. Sosebee (eds.). Wildland plants: physiological ecology and developmental morphology. Society for Range Management, Denver, CO.
Cook, C.W., and J. Stubbendieck. 1986. Range research: basic problems and techniques. Society for Range Management, Denver, CO. 317p.
Coyne, P.I., M.J. Trlica, and C.E. Owensby. 1995.Carbon and nitrogen dynamics in range plants. p. 59-167. in D.J. Bedunah and R.E. Sosebee (eds.). Wildland plants: physiological ecology and developmental morphology. Society for Range Management, Denver, CO.
Crider, F.J. 1955. Root-growth stoppage resulting from defoliation of grass. USDA Technical Bulletin 1102.
Langer, R.H.M. 1972. How grasses grow. Edward Arnold, London, Great Britain.
Manske, L.L. 1999. Can native prairie be sustained under livestock grazing? Provincial Museum of Alberta. Natural History Occasional Paper No. 24. Edmonton, Alberta, Canada. p.99-108.
Manske, L.L. 2018a. Restoring degraded grasslands. pp. 325-351. in A. Marshall and R. Collins (eds.). Improving grassland and pasture management in temperate agriculture. Burleigh Dodds Science Publishing, Cambridge, UK.
Manske, L.L. 2018b. Grass Vegetation: An indispensable biotic component of the Northern Mixed Grass Prairie. NDSU Dickinson Research Extension Center. Rangeland Research Outreach Program DREC 18-4029. Dickinson, ND. 53p.
Manske, L.L. 2020. Undisturbed management of grassland habitat is not a biologically sustainable treatment. NDSU Dickinson Research Extension Center. Range Research Report DREC 20-1194. Dickinson, ND. 5p.
Manske, L.L. 2021. Biologically effective management of Northern Plains grasslands using ecologically scientific principles. NDSU Dickinson Research Extension Center. Range Research Report DREC 21-6000. Dickinson, ND. 92p.
Peltzer, D.A., and M. Kochy. 2001. Competitive effects of grasses and woody plants in mixed grass prairie. n Journal of Ecology 89:519-527.
Low Herbage Production Caused by Traditional
Grazing Practices Can Be Corrected
Llewellyn L. Manske PhD
Scientist of Rangeland Research
North Dakota State University
Dickinson Research Extension Center
Report DREC 23-3100
Acquiring proficiency in the husbandry of livestock agriculture is a life-long apprenticeship, usually with the primary basics learned from grandfather and father tutelage. However, correction of the problems caused by traditional grazing practices requires basic science knowledge of the functionality of grassland ecosystems and of the enhanced applied scientific grazing management of modern high performance livestock which were not available to past mentors. As a consequence, the present administrators of grassland holdings within generational livestock agricultural enterprises typically have greater difficulty with the paradigm shift from family traditional grazing practices to applied scientific grazing management, than with the actual on the ground changes needed in order to implement a biologically effective grazing strategy. Making the transition from long held traditional grazing concepts is difficult, however, utilizing a biological effective grazing strategy has tremendous new possibilities.
Native grasslands are not inherently low producers. Grasslands are biologically capable of herbage production at greater quantities than the typical current levels of biomass when managed with traditional practices.
The reason native grasslands typically do not produce herbage at biologically capable levels is that all of the traditional management practices in use are loosely guided by the observed changes in only the aboveground vegetation. The omission of concern for the changes in the belowground components results in antagonistic effects to the critical ecosystem biogeochemical processes and to the four major internal grass growth mechanisms causing inhibitions of much of the potential herbage biomass production.
The greatest problem with these traditional practices is the inevitability of low quantities of available mineral nitrogen. However, Northern Plains grasslands are not deficient in nitrogen. Intact (never plowed) grasslands contain 5 to 6 tons/ac of organic nitrogen. Application of supplemental nitrogen fertilizer or interseeding alfalfa exacerbate the conditions.
Organic nitrogen is not available for autotrophic plant growth. Plants can use only inorganic nitrogen. The organic nitrogen must be transformed into mineral nitrogen by soil microbes. The problem of low quantities of available mineral nitrogen in grasslands is actually a deficiency in the biomass of rhizosphere microbes. This deficiency in biomass of soil microbes exists in grasslands because the microbes require an external source of short chain carbon energy. The microflora trophic level (bacteria and fungi) are achlorophyllous and cannot capture their own carbon energy. In addition, grass plant natural carbohydrate leakage from their roots is very low. This low amount of carbon compound leakage is typically barely enough to sustain a small rhizosphere biomass of around 55 kg/m3 (245 tons/ac) that can transform only around 25 lbs N/ac, which is much less than the required threshold minimum level of available mineral nitrogen at 100 lbs/ac or greater.
The only large source of surplus fixed carbohydrates in native grasslands is in the grass lead tillers at vegetative growth stages between the 3.5 new leaf stage and the flower stage during 1 June to 15 July. Grasses do not store surplus carbohydrates like most other plants but slowly burn the surplus quantities during night respiration. Grasses do store carbohydrates during the winter hardening period of mid August to hard frost for use during the winter dormancy inactive period.
The only way to transfer the surplus carbohydrates from the grass lead tillers into the rhizosphere zone surrounding the grass roots is by the exudation process that can be activated by partial defoliation by grazing graminivores that remove only 25% to 33% of the aboveground grass tiller biomass during vegetative growth stages. The availability of this external short chain carbon energy in the rhizosphere permits the microbes to increase in biomass and activity. Conversion of management from traditional practices to biologically effective grazing requires about three years to build the microbe biomass large enough to be able to transform 100 lbs/ac mineral nitrogen, which will require a microbe biomass at around 216 kg/m3 (964 tons/ac). Annual partial defoliation treatments by grazing graminivores must continue to maintain a high rate of microbe activity.
The second greatest problem with traditional grazing practices is the reduction of crude protein in grass lead tillers during late July and remaining below lactating cow requirements from early August to the end of the grazing season in mid October. The crude protein deficiency in grass lead tillers causes cow milk production to decrease greatly and calf weight gains to drop below their genetic potential rates. These annual losses in animal performance are costly.
This problem has a built in biological solution in Northern Plains grasslands. Perennial grasses vegetatively produce new tillers by activated growth of axillary buds. Grass plants rarely use sexual reproduction and the development of seedlings because seedlings cannot effectively compete with tillers. Each new leaf produces an axillary bud. The axillary buds are inhibited from growth by the hormone, auxin, that is produced in the apical meristem and young developing leaves. Partial defoliation by grazing graminivores that removes 25% to 33% of the young leaf material from second year grass lead tillers at phenological growth between the 3.5 new leaf stage and the flower stage during 1 June to 15 July removes enough auxin that permits the growth hormone, cytokinin, to stimulate vegetative growth of secondary tillers from the meristematic tissue in the axillary buds. The secondary tillers will grow if 100 lbs/ac or greater of mineral nitrogen is available. After the secondary tillers produce their 3.5 new leaf, these tillers can provide adequate quantities of crude protein for lactating cows to maintain a high level of milk production that can then maintain calf rate of weight gain at near genetic potential from early August to mid October.
Between the mid 1970’s and the late 1990’s, much of the basic science of how grasslands function was explained. The applied science needed to activate grassland ecosystems to full functionality was determined at Dickinson REC. It is now possible for grassland managers to activate by grazing the four major grass growth mechanisms and the ecosystem biogeochemical processes that are capable of maintaining elevated herbage biomass production at biological potential rates which corrects the problems of the inhibited level of herbage production caused by traditional practices.
Northern Plains grasslands are complex ecosystems that are exceedingly more complex than the most complicated machines built by humans. Grasslands are composed of indispensable biotic components and abiotic factors. The indispensable biotic components are grass vegetation, rhizosphere organisms, and grazing graminivores that have complex symbiotic relationships and have fundamental biological and physiological requirements that must be met. The abiotic factors are radiant energy from sunlight, the climatic forces of light, precipitation, and temperature, the functioning constituents of soil, the major essential elements of carbon, hydrogen, nitrogen, and oxygen, the minor essential elements, and the environmental conditions of drought and fire.
The indispensable grass vegetation is autotrophic and uses the major and minor essential elements in the inorganic form to synthesize vital organic components of carbohydrates, proteins, and nucleotides as plant structures and as nutritious forage for heterotrophic large grazing graminivores. Grass plants produce double the leaf biomass than is needed for photosynthesis in order to attract the vital partial defoliation by grazing graminivores on which their four major physiological internal growth mechanisms depend. The four major growth mechanisms are activated by partial defoliation that removes 25% to 33% of the leaf biomass from grass lead tillers at vegetative growth stages between the 3.5 new leaf stage and the flower stage that enable grass tillers to withstand and recover from grazing by large graminivores.
The complementary physiological growth mechanisms give grass plants the capacity to replace lost leaf and shoot biomass following grazing by increasing meristematic tissue activity, increasing photosynthetic capacity of remaining mature leaves and rejuvenated portions of older leaves not completely senescent, increasing allocation of carbon fixed during current elevated photosynthetic rates, and increasing availability of soil mineral nitrogen transformed from soil organic nitrogen by active rhizosphere organisms. Fully activated growth mechanisms can produce replacement foliage at 140% of the weight removed during grazing when mineral nitrogen is available at 100 lbs/ac or greater.
Vegetative reproduction by tillering produces secondary tillers from the growth of axillary buds following partial defoliation by grazing graminivores during lead tiller vegetative growth stages. Recruitment of new grass plants by sexual reproduction and the development of seedlings is negligible in grasslands.
Nutrient and water resource uptake is highly competitive in healthy grass tillers and maintains the dominance of grasses in the ecosystem, and suppresses the establishment of grass, forbs, and shrub seedlings.
Water use efficiency in grass herbage biomass production is variable and directly linked with the threshold quantity of available mineral nitrogen at 100 lbs/ac or greater; when the available mineral nitrogen is at less than 100 lbs/ac, the weight of herbage production is reduced by 49.6% per inch of precipitation received.
The indispensable rhizosphere microorganisms perform the ecosystem nutrient cycling and flow activities and the ecosystem biogeochemical processes that determine grassland productivity and functionality. Biogeochemical processes transform stored essential elements from organic forms or ionic forms into plant usable mineral forms. Biogeochemical processes capture replacement quantities of lost or removed major essential elements of carbon, hydrogen, nitrogen, and oxygen with assistance from active live plants and transfers the replacement essential elements into storage as soil organic matter for later use. And biogeochemical processes decompose complex unusable organic material into compounds and then into reusable major and minor essential elements.
The indispensable grazing graminivores are vital for grassland ecosystems and are most beneficial when grazing periods are coordinated with grass phenological growth stages. Partial defoliation by large graminivores of grass lead tillers at vegetative growth stages cause the exudation of large quantities of short chain carbon energy from the grass lead tillers surplus carbohydrates through the roots into the rhizosphere that provide the required external energy needed by the microbes for growth and activity.
A biologically effective grazing strategy is designed to coordinate partial defoliation grazing events with grass phenological growth stages, to meet the nutrient requirements of modern high performance livestock the entire grazing season, to provide the biological requirements of the grass plants and the rhizosphere microorganisms, to enhance the ecosystem biogeochemical processes, and to activate the four major internal grass plant physiological growth mechanisms in order for grassland ecosystems to function at the greatest achievable levels, and to deliver unlimited new possibilities.
Acknowledgement
I am grateful to Sheri Schneider for assistance in the production of this manuscript.
To get additional information on the Biologically Effective Strategy Go To:
Dickinson REC 2019 Annual Reports
Advanced Pasture Forage Management
Advanced Harvested Forage Management
Increasing Organic Carbon in Northern Plains Grassland Soils
Llewellyn L. Manske PhD
Scientist of Rangeland Research
North Dakota State University
Dickinson Research Extension Center
Report DREC 23-5007a
Carbon is the fourth most abundant element in the universe by mass. Carbon based compounds form the basis of all life on earth. Carbon can form more different compounds than all other elements combined. The carbon cycle is a major biogeochemical cycle in which carbon is exchanged among the atmosphere, plants, and soil. Autotrophic plants use solar energy, atmospheric carbon dioxide plus water to produce carbohydrates and oxygen. Heterotrophic organisms depend on photosynthetic carbohydrates as a source of energy and other carbon compounds. Carbon is a major essential element required for life to be maintained (Anonymous 2023, FAO 2023).
Carbon as carbon dioxide in the atmosphere is a vital greenhouse gas that has for 10,000 years been providing a constant warm normal global temperature in which some water is liquid and life as we know can persist (Anonymous 2023). Atmospheric carbon dioxide reradiates some of earth’s escaping longwave infrared energy in order to maintain a stable global temperature (Working Group I 2007).
However, since the start of the industrial revolution in 1750, the quantity of carbon in the atmosphere has increased above the optimal level which is causing greater quantities of longwave infrared energy to be returned back to earth causing the mean global temperature to increase (Working Group I 2007).
The source of the increased carbon emissions in the atmosphere is from the extraction and burning of geologic fossil carbon for fuel (Rosen 2021). After 270 years, the additional carbon in the atmosphere has increased the mean global temperature by about 1.2° C (2.16° F) (Rosen 2021).
The amount of carbon on earth is effectively constant. The deep earth contains about 2.039 billion billion tons of carbon with about 66% of that in the core. The oceans contain about 44,092 billion tons of carbon. Geologic fossil fuels (coal, oil, and natural gas) consist of about 4,409 billion tons of carbon. The terrestrial soils contain about 1,764 billion tons of carbon. The atmosphere consists of about 1,006 billion tons of carbon. The biosphere consisting of all terrestrial plants and animals contain about 672 million tons of carbon. The earth’s soils contain more carbon than the atmosphere and all the plants and animals combined (Anonymous 2022, 2023).
The soils of grasslands are storing large quantities of carbon but are capable of holding much more carbon than they currently do (FAO 2023). A substantial increase in terrestrial soil organic carbon from atmospheric carbon dioxide captured and fixed during plant photosynthesis can be as effective at reducing the rate of global warming as the primary objective to reduce emissions of carbon dioxide from fossil fuel burning (FAO 2017).
During the eighteen year period of 1990 to 2007, terrestrial soil organic carbon storage increased at a rate of 2.76 billion tons C/yr (Schimel et al. 2015). During the eleven year period of 2007 to 2017, terrestrial soil organic carbon storage increased at a rate of 3.98 billion tons C/yr (Keenan and Williams 2018). The increases in the quantities of atmospheric carbon dioxide have improved the efficiencies of plant photosynthetic processes resulting in increased plant biomass growth and thus greater dead plant material entering the soil and increasing the quantity of soil organic carbon.
The increase in plant biomass production resulting from the increase of atmospheric carbon dioxide causing an improved efficiency in photosynthesis can be enhanced on grasslands by increasing the quantity of available mineral nitrogen, by increasing the biomass of rhizosphere microorganisms, by increasing the quantity of exudated short carbon energy from the surplus fixed carbon produced by lead grass tillers during vegetative growth stages, by removing 25% to 33% of the aboveground leaf biomass with partial defoliation by grazing livestock during the period of 1 June to 15 July (Manske 2018).
The increase of atmospheric carbon dioxide plus the increase in available mineral nitrogen will result in a greater increase in grass herbage biomass that will permit a 40% increase in stocking rate above the standard seasonlong stocking rate for the particular pasture soil types.
The greater the increase in grass herbage biomass production, the greater the increase in the quantity of soil organic carbon.
Perennial grasses consist of 44% carbon, 40% oxygen, 8% hydrogen, and 8% minerals (Manske 2013).
The source of soil organic carbon in grasslands is dead plant and soil microbial material which originated from atmospheric CO2 captured and fixed during plant photosynthesis, and additionally, from the deposits of manure and urine by grazing livestock.
Greater quantities of soil organic carbon improve the physical and chemical properties of soil and soil health, by increasing nutrient storage and availability, increasing cation exchange capacity, increasing particle aggregation, improving soil structure and stability, and increasing water holding capacity (FAO and ITPS 2015).
Efforts to increase the quantities of soil organic carbon in grasslands through implementation of biologically effective management will cause extensive improvement in ecosystem functionality and great increases in grass herbage biomass production which results in the increase in economic wealth captured per acre. These ecosystem improvements and the resulting reductions of atmospheric CO2 are sufficient enough by themselves to justify the needed changes in management practices.
Soil organic carbon is usually categorized into three pools: a labile pool, an intermediate pool, and a refractory (stable) pool. The concept of organic carbon pools are used for improving understanding of SOC dynamics. The quantity of carbon allocated to each pool cannot be measured separately. The labile pool includes easily degradable plant material, microbial biomass, and labile metabolites, and may turn over within a few months or years. The intermediate pool comprises microbially processed organic matter that is partially stabilized on mineral surfaces which also may be protected within aggregates, with turn over times in the range of decades. The refractory pool includes the highly stabilized organic matter and mineral complexes that may remain in soils for centuries or millennia (FAO and ITPS 2015).
Long term stabilization of soil organic carbon requires action from microorganisms and occurs from the interaction of reactive mineral surface area with decomposed products derived by microbial enzymatic breakdown and metabolism forming a surface binding within microaggregates which reduces exposure to additional enzymatic degradation (FAO and ITPS 2015).
Soils do have some inorganic carbon (SIC) as carbonates and hydrogencarbonates (bicarbonate), which have little importance in the biogeochemical processes within a grassland ecosystem (FAO and ITPS 2015).
The quantity of soil organic carbon is dynamic, determined by the balance of carbon material entering the soil as organic residue, and the amount leaving the soil as CO2 through microbial decomposition and respiration. Organic carbon material must be continually added as annual input to the soil (FAO 2017).
The quantity of carbon respired from soils was derived from decomposition of soil organic matter input by soil microbes and was approximately balanced with the quantity of atmospheric CO2 captured and fixed by the annual net primary production of plant biomass (Schimel et al. 1997).
The CO2 released by burning geologic fossil fuels contain carbon with different isotopic ratios than the carbon from plant residue decomposed and released from soils by microbial respiration as CO2 (Anonymous 2023).
The annual quantity of CO2 released from soils to the atmosphere is about ten times larger than the annual quantity of CO2 released to the atmosphere by fossil fuel burning (Schimel 1995). As a result of the improvements in the efficiencies of plant photosynthetic processes, the increases in the quantities of atmospheric carbon dioxide removal, and the increases in the quantities of terrestrial soil carbon storage now occur at a rate equivalent to all of the CO2 emissions from the soils plus about 33.7% of the CO2 emissions from all the fossil fuel burning per year. This is the reason, the rate of global warming is increasing at a rate slower than expected (Schimel et al. 2015, Keenan and Williams 2018).
Nutrient cycling and availability has superior effectiveness and improved efficiencies in highly functional grasslands with soils containing greater quantities of organic carbon (FAO and ITPS 2015). Most of the nutrients consumed and used by livestock for maintenance are returned to the ecosystem in feces and urine. About 15% of the nutrients contained in the consumed leaf material is extracted by stocker heifers and steers and retained for growth. About 30% of the nutrients contained in the consumed leaf material is extracted by lactating cows, with a portion retained by the cow for production, and the remainder of the extracted nutrients passed to her calf for growth (Russelle 1992, Gibson 2009).
During the growing season, a 1200 pound lactating cow consumes 915 lbs forage per month, (44% C) 403 lbs per month is carbon, (25-40%, mean 33%) 133 lbs per month is nondigestible carbon and returned to the soil through feces and urine (FAO 2023), (67%) 270 lbs of carbon per month is digestible, with (30%) 81 lbs of carbon per month used by cow and calf for growth and the remainder used for maintenance.
Nearly all of the essential elements used in the annual production of plant herbage biomass, soil organism biomass, insect biomass, and wildlife biomass are retained and recycled within the grassland ecosystem and only a small portion of the essential elements are removed by livestock as growth in weight (Manske 2013). Fully functional grassland ecosystems with large quantities of stored soil organic carbon are capable of capturing greater quantities of carbon, hydrogen, nitrogen, and oxygen than the amounts lost or removed annually.
Northern Plains grassland ecosystems are perpetually sustainable with the implementation of biologically effective grazing management strategies that activate all ecosystem biogeochemical processes and all grass plant physiological growth mechanisms to function at biologically potential levels (Manske 2018).
Soil Organic Carbon Project
A project was started in 2022 to quantitatively determine the amount of soil organic carbon accumulation differences in Northern Plains native mixed grass prairie soils managed by three treatments.
Study Area
The native rangeland study sites were on the Dickinson Research Extension Center (DREC) ranch, located in Dunn County, 20 miles north of Dickinson, in western North Dakota.
Long-term mean annual temperature was 42.2° F (5.7° C). January was the coldest month, with a temperature of 14.9° F (-9.5° C). July and August were the warmest months, with mean temperatures of 69.7° F (20.9° C) and 68.5° F (20.3° C), respectively. Long-term mean annual precipitation was 17.1 inches (434.3 mm). The amount of precipitation received during the perennial plant growing season (April to October) was 14.5 inches (367.3 mm) and was 84.6% of the annual precipitation (Manske 2023).
Soils were primarily Typic Haploborolls. The native rangeland vegetation was the Wheatgrass-Needlegrass Type (Barker and Whitman 1988, Shiflet 1994) of the mixed grass prairie. The dominant native range grasses were western wheatgrass (Pascopyrum smithii), needle and thread (Hesperostipa comata), blue grama (Bouteloua gracilis), and threadleaf sedge (Carex filifolia).
Management Treatments
Three management treatments were initiated in 1983 and have been evaluated for 40 years in 2022 (1) long-term nongrazed control, (2) traditional sesonlong, and (3) twice-over rotation system.
The long-term nongrazed control management treatment was designed with two large replicated exclosures and had not been grazed, mowed, or burned for more than 30 years before initiation.
The traditional seasonlong treatment was designed with two replicated pastures. Each pasture was grazed for 137 days from early June to mid October stocked at 2.86 acres per cow-calf pair per month.
The twice-over rotation grazing system was designed with two replicated systems each with three pastures. Each pasture was grazed two times per growing season, 15 days the 1st rotation and 30 days the 2nd rotation plus 2 days for compensation for rotation dates on weekends. Each system was grazed 137 days from early June to mid October stocked at 2.20 acres per cow-calf pair per month.
Procedure
Soil organic carbon (SOC) was determined from four replicated soil core samples collected at silty ecological sites from protected exclosures for the nongrazed treatment, and from grazed sites for the seasonlong and twice-over rotation treatments with the 1 inch Veihmeyer soil tube at incremental depths of 0-6, 6-12, 12-24 inches on monthly periods during May, June, and July. Analysis of soil core samples for total organic carbon was conducted at the North Dakota State University Soil Testing Laboratory.
Results
The Food and Agriculture Organization (FAO) of the United Nations has completed its Global assessment of soil carbon in grasslands on 14 February 2023. The improved natural grasslands of North America which are the more productive native grasslands minus high sand and high clay sites (occupying most of the combined area of north and south mix grass prairie) has a mean quantity of stored SOC to a 30 cm (12 in) depth at 26.76 tons C/ac and has a mean annual input of 1.1 tons C/ac/yr and has a mean minimum quantity of annual input needed to maintain the current storage level was 0.62 tons C/ac/yr (FAO 2023).
The FAO data including the northern and southern mixed grass prairie was compared to the 2022 Northern Plains mixed grass prairie data from our SOC project on the three management treatments. On the nongrazed treatment, the stored SOC to a 30 cm (12 in) depth was 33.25 tons C/ac with an annual input of 1.00 tons C/ac/yr. On the seasonlong treatment, the stored SOC to a 30 cm (12 in) depth was 47.90 tons C/ac with an annual input of 0.84 tons C/ac/yr. On the twice-over treatment, the stored SOC to a 30 cm (12 in) depth was 64.34 tons C/ac with an annual input of 2.21 tons C/ac/yr.
The mean amount of stored SOC on the improved native mixed grass grasslands of North America was only 26.76 tons C/ac. The quantity of stored SOC on the nongrazed treatment was 24.3% greater. The quantity of stored SOC on the seasonlong treatment was 79.0% greater. The quantity of stored SOC on the twice-over treatment was 140.7% greater. The annual input quantities on the nongrazed and seasonlong treatments were less than that on the improved grasslands, however, the annual input quantities on the nongrazed and seasonlong treatments were greater than the minimum annual input on the improved grasslands. The annual input quantity on the twice-over treatment was 100.9% greater than that on the improved grasslands.
The FAO stored SOC data from the improved grasslands of North America included both the northern and southern mixed grass prairies. The distribution of SOC quantity is strongly influenced by temperature and precipitation. The southern mixed grass prairie has higher temperatures and greater evapotranspiration and thus lower stored SOC than the northern mixed grass prairie (FAO 2023).
Acknowledgment
I am grateful to Sheri Schneider for assistance in production of this manuscript and for development of the table. I am grateful to John Urban for assistance in this project for field data collection.
| Table 1. Total organic carbon at two soil depths and at three dates as a percentage, pounds per acre, and tons per acre from three treatments, twice-over, seasonlong, and nongrazed, 2022. | |||||||||
|---|---|---|---|---|---|---|---|---|---|
| 15-May | 15-Jun | 15-Jul | |||||||
| Soil | |||||||||
| Depth | |||||||||
| Inches | OC% | lbs/ac | Tons/ac | OC% | lbs/ac | Tons/ac | OC% | lbs/ac | Tons/ac |
| Twice-over | |||||||||
| 0-6 | 5.83 | 91,161.79 | 45.58 | 4.91 | 76,776.05 | 38.39 | 5.2 | 81,310.69 | 40.66 |
| 12-Jun | 2.9 | 51,261.09 | 25.63 | 2.14 | 37,827.15 | 18.91 | 2.7 | 47,725.84 | 23.86 |
| 0-12 | 71.21 | 57.3 | 64.52 | ||||||
| Seasonlong | |||||||||
| 0-6 | 4.22 | 65,986.75 | 32.99 | 3.99 | 62,390.32 | 31.2 | 3.85 | 60,201.18 | 30.1 |
| 12-Jun | 2.17 | 38,357.43 | 19.18 | 1.65 | 29,165.79 | 14.58 | 1.77 | 31,286.94 | 15.64 |
| 0-12 | 52.17 | 45.78 | 45.74 | ||||||
| Nongrazed | |||||||||
| 0-6 | 2.57 | 40,186.24 | 20.09 | 2.49 | 38,935.31 | 19.47 | 2.51 | 39,248.04 | 19.62 |
| 12-Jun | 1.75 | 30,933.41 | 15.47 | 1.48 | 26,160.83 | 13.08 | 1.36 | 24,039.68 | 12.02 |
| 0-12 | 35.56 | 32.55 | 31.64 | ||||||
Literature Cited
Anonymous. 2022. The earths carbon pools. Kansas State Univ. 4p.
Anonymous. 2023. Carbon dioxide in Earth’s atmosphere. wikipedia.org. 25p.
Barker, W.T., and W.C. Whitman, 1988. Vegetation of the Northern Great Plains. Rangelands 10:266-272.
FAO and ITPS. 2015. Status of the world’s soil resources, Food and Agriculture Organization of the United Nations and Intergovernmental Technical Panel on Soils. Rome, Italy. 605p.
FAO. 2017. Soil organic carbon: the hidden potential. Food and Agriculture Organization of the United Nations. Rome, Italy. 77p.
FAO. 2023. Global assessment of soil carbon in grasslands. Food and Agriculture Organization of the United Nations. Paper No. 187. Rome, Italy. 52p.
Gibson, D.J. 2009. Grasses and grassland ecology. Oxford University Press Inc. New York, NY. 305p.
Keenan, T.F., and C.A. Williams. 2018. The terrestrial carbon sink. Annual Review of Environmental and Resources. 43:219-243.
Manske, L.L. 2013. Perpetually sustainable grazingland ecosystems. NDSU Dickinson Research Extension Center. Summary Range Management Report DREC 13-3060. Dickinson, ND. 4p.
Manske, L.L. 2018. Restoring degraded grasslands. pp. 325-351. in A. Marshall and R.Collins (eds.). Improving grassland and pasture management in temperate agriculture. Burleigh Dodds Science Publishing, Cambridge, UK.
Manske, L.L. 2023. Range plant growth related to climatic factors of western North Dakota, 1982-2022. NDSU Dickinson Research Extension Center. Range Research Report DREC 23-1078l. Dickinson, ND. 22p.
Rosen, J. 2021. The science of climatic change explained: facts, evidence, and proof. The New York Times. nytimes.com. 20p.
Russelle, M.P. 1992. Nitrogen cycling in pastures and range. Journal of Production Agriculture 5:13-23.
Schimel, D.S. 1995. Terrestrial ecosystems and the carbon cycle. Global Change Biology 1(1):77-91.
Schimel, D.S., B.H. Braswell, and W.J. Parton. 1997. Equilibrations of the terrestrial water, nitrogen, and
carbon cycles. Proceedings of the National Academy of Science, USA. 94:8280-8283.
Schimel, D., B.B. Stephens, and J.B. Fisher. 2015. Effects of increasing CO2 on the terrestrial carbon cycle. Proceedings of the National Academy of Science, USA. 112(2):436-441.
Shiflet, T.N. (ed.). 1994. Rangeland cover types. Society of Range Management. Denver, CO. 152p.
Working Group I. 2007. Historical overview of climate change science. The fourth assessment report on climate change. Cambridge University Press, Cambridge, United Kingdom, and New York, NY. 35p.
Range Plant Growth Related to Climatic Factors
of Western North Dakota, 1982-2023.
Llewellyn L. Manske PhD
Scientist of Rangeland Research
North Dakota State University
Dickinson Research Extension Center
Report DREC 24-1078m
Introduction
Successful long-term management of grassland ecosystems requires knowledge of the relationships of range plant growth and regional climatic factors. Range plant growth and development are regulated by climatic conditions. Length of daylight, temperature, precipitation, and water deficiency are the most important climatic factors that affect rangeland plants (Manske 2011).
Light
Light is necessary for plant growth because light is the source of energy for photosynthesis. Plant growth is affected by variations in quality, intensity, and duration of light. The quality of light (wavelength) varies from region to region, but the quality of sunlight does not vary enough in a given region to have an important differential effect on the rate of photosynthesis. However, the intensity (measurable energy) and duration (length of day) of sunlight change with the seasons and affect plant growth. Light intensity varies greatly with the season and with the time of day because of changes in the angle of incidence of the sun’s rays and the distance light travels through the atmosphere. Light intensity also varies with the amount of humidity and cloud cover because atmospheric moisture absorbs and scatters light rays.
The greatest variation in intensity of light received by range plants results from the various degrees of shading from other plants. Most range plants require full sunlight or very high levels of sunlight for best growth. Shading from other plants reduces the intensity of light that reaches the lower leaves of an individual plant. Grass leaves grown under shaded conditions become longer but narrower, thinner (Langer 1972, Weier et al. 1974), and lower in weight than leaves in sunlight (Langer 1972). Shaded leaves have a reduced rate of photosynthesis, which decreases the carbohydrate supply and causes a reduction in growth rate of leaves and roots (Langer 1972). Shading increases the rate of senescence in lower, older leaves. Accumulation of standing dead leaves ties up carbon and nitrogen. Decomposition of leaf material through microbial activity can take place only after the leaves have made contact with the soil. Standing dead material not in contact with the soil does not decompose but breaks down slowly as a result of leaching and weathering. Under ungrazed treatments the dead leaves remain standing for several years, slowing nutrient cycles, restricting nutrient supply, and reducing soil microorganism activity in the top 12 inches of soil. Standing dead leaves shade early leaf growth in spring and therefore slow the rate of growth and reduce leaf area. Long-term effects of shading, such as that occurring in ungrazed grasslands and under shrubs or leafy spurge, reduce the native grass species composition and increase composition of shade-tolerant or shade- adapted replacement species like smooth bromegrass and Kentucky bluegrass.
Day-length period (photoperiod) is one of the most dependable cues by which plants time their activities in temperate zones. Day-length period for a given date and locality remains the same from year to year. Changes in the photoperiod function as the timer or trigger that activates or stops physiological processes bringing about growth and flowering of plants and that starts the process of hardening for resistance to low temperatures in fall and winter. Sensory receptors, specially pigmented areas in the buds or leaves of a plant, detect day length and night length and can activate one or more hormone and enzyme systems that bring about physiological responses (Odum 1971, Daubenmire 1974, Barbour et al. 1987).
The phenological development of rangeland plants is triggered by changes in the length of daylight. Vegetative growth is triggered by photoperiod and temperature (Langer 1972, Dahl 1995), and reproductive initiation is triggered primarily by photoperiod (Roberts 1939, Langer 1972, Leopold and Kriedemann 1975, Dahl 1995) but can be slightly modified by temperature and precipitation (McMillan 1957, Leopold and Kriedemann
1975, Dahl and Hyder 1977, Dahl 1995). Some plants are long-day plants and others are short-day plants. Long-day plants reach the flower phenological stage after exposure to a critical photoperiod and during the period of increasing daylight between mid April and mid June. Generally, most cool-season plants with the C3 photosynthetic pathway are long-day plants and reach flower phenophase before 21 June. Short-day plants are induced into flowering by day lengths that are shorter than a critical length and that occur during the period of decreasing day length after mid June. Short-day plants are technically responding to the increase in the length of the night period rather than to the decrease in the day length (Weier et al. 1974, Leopold and Kriedemann 1975). Generally, most warm-season plants with the C4 photosynthetic pathway are short-day plants and reach flower phenophase after 21 June.
The annual pattern in the change in daylight duration follows the seasons and is the same every year for each region. Grassland management strategies based on phenological growth stages of the major grasses can be planned by calendar date after the relationships between phenological stage of growth of the major grasses and time of season have been determined for a region.
Temperature
Temperature is an approximate measurement of the heat energy available from solar radiation. At both low and high levels temperature limits plant growth. Most plant biological activity and growth occur within only a narrow range of temperatures, between 32o F (0° C) and 122o F (50o C) (Coyne et al. 1995). Low temperatures limit biological reactions because water becomes unavailable when it is frozen and because levels of available energy are inadequate. However, respiration and photosynthesis can continue slowly at temperatures well below 32o F if plants are “hardened”. High temperatures limit biological reactions because the complex structures of proteins are disrupted or denatured.
Periods with temperatures within the range for optimum plant growth are very limited in western North Dakota. The frost-free period is the number of days between the last day with minimum temperatures below 32o F (0o C) in the spring and the first day with minimum temperatures below 32o F (0o C) in the fall and is approximately the length of the growing season for annually seeded plants. The frost-free period for western North Dakota generally lasts for 120 to 130 days, from mid to late May to mid to late September (Ramirez 1972). Perennial grassland plants are capable of growing for periods longer than the frost-free period, but to continue active growth they require temperatures above the level that freezes water in plant tissue and soil. Many perennial plants begin active growth more than 30 days before the last frost in spring and continue growth after the first frost in fall. The growing season for perennial plants is considered to be between the first 5 consecutive days in spring and the last 5 consecutive days in fall with mean daily temperature at or above 32o F (0o C). In western North Dakota the growing season for perennial plants is considered to be generally from mid April through mid October. Low air temperature during the early and late portions of the growing season greatly limits plant growth rate. High temperatures, high evaporation rates, drying winds, and low precipitation levels after mid summer also limit plant growth.
Different plant species have different optimum temperature ranges. Cool-season plants, which are C3 photosynthetic pathway plants, have an optimum temperature range of 50̊ to 77̊F (10̊ to 25̊C). Warm-season plants, which are C4 photosynthetic pathway plants, have an optimum temperature range of 86̊ to 105̊F (30̊ to 40̊C) (Coyne et al. 1995).
Water (Precipitation)
Water, an integral part of living systems, is ecologically important because it is a major force in shaping climatic patterns and biochemically important because it is a necessary component in physiological processes (Brown 1995). Water is the principal constituent of plant cells, usually composing over 80% of the fresh weight of herbaceous plants. Water is the primary solvent in physiological processes by which gases, minerals, and other materials enter plant cells and by which these materials are translocated to various parts of the plant. Water is the substance in which processes such as photosynthesis and other biochemical reactions occur and a structural component of proteins and nucleic acids. Water is also essential for the maintenance of the rigidity of plant tissue and for cell enlargement and growth in plants (Brown 1977, Brown 1995).
Water Deficiency
Temperature and precipitation act together to affect the physiological and ecological status of range plants. The biological situation of a plant at any time is determined by the balance between rainfall and potential evapotranspiration. The higher the temperature, the greater the rate of evapotranspiration and the greater the need for rainfall to maintain homeostasis. When the amount of rainfall received is less than potential evapotranspiration demand, a water deficiency exists. Evapotranspiration demand is greater than precipitation in the mixed grass and short grass prairie regions. The tall grass prairie region has greater precipitation than evapotranspiration demand. Under water deficiency conditions, plants are unable to absorb adequate water to match the transpiration rate, and plant water stress develops. Range plants have mechanisms that help reduce the damage from water stress, but some degree of reduction in herbage production occurs.
Plant water stress limits growth. Plant water stress develops in plant tissue when the rate of water loss through transpiration exceeds the rate of water absorption by the roots. Water stress can vary in degree from a small decrease in water potential, as in midday wilting on warm, clear days, to the lethal limit of desiccation (Brown 1995).
Early stages of water stress slow shoot and leaf growth. Leaves show signs of wilting, folding, and discoloration. Tillering and new shoot development decrease. Root production may increase. Senescence of older leaves accelerates. Rates of cell wall formation, cell division, and protein synthesis decrease. As water stress increases, enzyme activity declines and the formation of necessary compounds slows or ceases. The stomata begin to close; this reaction results in decreased rates of transpiration and photosynthesis. Rates of respiration and translocation decrease substantially with increases in water stress. When water stress becomes severe, most functions nearly or completely cease and serious damage occurs. Leaf and root mortality induced by water stress progresses from the tips to the crown. The rate of leaf and root mortality increases with increasing stress. Water stress can increase to a point that is lethal, resulting in damage from which the plant cannot recover. Plant death occurs when meristems become so dehydrated that cells cannot maintain cell turgidity and biochemical activity (Brown 1995).
Study Area
The study area is the region around the Dickinson Research Extension Center (DREC) Ranch, Dunn County, western North Dakota, USA. Native vegetation in western North Dakota is the Wheatgrass-Needlegrass Type (Barker and Whitman 1988, Shiflet 1994) of the mixed grass prairie.
The climate of western North Dakota has changed several times during geologic history (Manske 1999). The most recent climate change occurred about 5,000 years ago, to conditions like those of the present, with cycles of wet and dry periods. The wet periods have been cool and humid, with greater amounts of precipitation. A brief wet period occurred around 4,500 years ago. Relatively long periods of wet conditions occurred in the periods between 2,500 and 1,800 years ago and between 1,000 and 700 years ago. Recent short wet periods occurred in the years from 1905 to 1916, 1939 to 1947, and 1962 to 1978. The dry periods have been warmer, with reduced precipitation and recurrent summer droughts. A widespread, long drought period occurred between the years 1270 and 1299, an extremely severe drought occurred from 1863 through 1875, and other more recent drought periods occurred from 1895 to 1902, 1933 to 1938, and 1987 to 1992. The current climatic pattern in western North Dakota is cyclical between wet and dry periods and has existed for the past 5,000 years (Bluemle 1977, Bluemle 1991, Manske 1994a).
Procedures
Daylight duration data for the Dickinson location of latitude 46° 48' N, longitude 102° 48' W, were tabulated from daily sunrise and sunset time tables compiled by the National Weather Service, Bismarck, North Dakota.
Temperature and precipitation data were taken from historical climatological data collected at the Dickinson Research Extension Center Ranch, latitude 47o 14' N, longitude 102o 50' W, Dunn County, near Manning, North Dakota, 1982-2023.
A technique reported by Emberger et al. (1963) was used to develop water deficiency months data from historical temperature and precipitation data. The water deficiency months data were used to identify months with conditions unfavorable for plant growth. This method plots mean monthly temperature (o C) and monthly precipitation (mm) on the same axis, with the scale of the precipitation data at twice that of the temperature data. The temperature and precipitation data are plotted against an axis of time. The resulting ombrothermic diagram shows general monthly trends and identifies months with conditions unfavorable for plant growth. Water deficiency conditions exist during months when the precipitation data bar drops below the temperature data curve and plants are under water stress. Plants are under temperature stress when the temperature curve drops below the freezing mark (0o C).
Results and Discussion
Light
The tilt of the earth’s axis in conjunction with the earth’s annual revolution around the sun produces the seasons and changes the length of daylight in temperate zones. Dickinson (figure 1) has nearly uniform day and night lengths (12 hours) during only a few days, near the vernal and autumnal equinoxes, 20 March and 22 September, respectively, when the sun’s apparent path crosses the equator as the sun travels north or south, respectively. The shortest day length (8 hours, 23 minutes) occurs at winter solstice, 21 December, when the sun’s apparent path is farthest south of the equator. The longest day length (15 hours, 52 minutes) occurs at summer solstice, 21 June, when the sun’s apparent path is farthest north of the equator. The length of daylight during the growing season (mid April to mid October) oscillates from about 13 hours in mid April, increasing to nearly 16 hours in mid June, then decreasing to around 11 hours in mid October (figure 1).
Temperature
The DREC Ranch in western North Dakota experiences severe, windy, dry winters with little snow accumulation. The springs are relatively moist in most years, and the summers are often droughty but are interrupted periodically by thunderstorms. The long-term (42-year) mean annual temperature is 42.2o F (5.7o C) (table 1).
January is the coldest month, with a mean temperature of 15.0o F (-9.4o C). July and August are the warmest months, with mean temperatures of 69.7o F (20.9o C) and 68.4° F (20.2o C), respectively. Months with mean monthly temperatures below 32.0o F (0.0o C) are too cold for active plant growth. Low temperatures define the growing season for perennial plants, which is generally from mid April to mid October (6.0 months, 183 days). During the other 6 months each year, plants in western North Dakota cannot conduct active plant growth. Soils are frozen to a depth of 3 to 5 feet for a period of 4 months (121 days) (Larson et al. 1968). The early and late portions of the 6- month growing season have very limited plant activity and growth. The period of active plant growth is generally 5.5 months (168 days).
Western North Dakota has large annual and diurnal changes in monthly and daily air temperatures. The range of seasonal variation of average monthly temperatures between the coldest and warmest months is 55.0o F (30.5° C), and temperature extremes in western North Dakota have a range of 161.0o F (89.4o C), from the highest recorded summer temperature of 114.0o F (45.6o C) to the lowest recorded winter temperature of -47.0o F (-43.9o C). The diurnal temperature change is the difference between the minimum and maximum temperatures observed over a 24-hour period. The average diurnal temperature change during winter is 22.0o F (12.2o C), and the change during summer is 30.0o F (16.7o C). The average annual diurnal change in temperature is 26.0o F (14.4o C) (Jensen 1972). The large diurnal change in temperature during the growing season, which has warm days and cool nights, is beneficial for plant growth because of the effect on the photosynthetic process and respiration rates (Leopold and Kriedemann 1975).
Precipitation
The long-term (42-year) annual precipitation for the Dickinson Research Extension Center Ranch in western North Dakota is 17.06 inches (433.33 mm). The long-term mean monthly precipitation is shown in table 1. The growing-season precipitation (April to October) is 14.41 inches (365.96 mm) and is 84.47% of annual precipitation. June has the greatest monthly precipitation, at 3.04 inches (77.32 mm).
The seasonal distribution of precipitation (table 2) shows the greatest amount of precipitation occurring in the spring (7.12 inches, 41.74%) and the least amount occurring in winter (1.62 inches, 9.50%). Total precipitation received for the 5-month period of November through March averages less than 2.65 inches (15.53%). The precipitation received in the 3-month period of May, June, and July accounts for 47.13% of the annual precipitation (8.04 inches).
The annual and growing-season precipitation levels and percent of the long-term mean for 42 years (1982 to 2023) are shown in table 3. Drought conditions exist when precipitation amounts for a month, growing season, or annual period are 75% or less of the long-term mean. Wet conditions exist when precipitation amounts for a month, growing season, or annual period are 125% or greater of the long-term mean. Normal conditions exist when precipitation amounts for a month, growing season, or annual period are greater than 75% and less than 125% of the long-term mean. Between 1982-2023, 5 drought years (11.90%) (table 4) and 7 wet years (16.67%) (table 5) occurred. Annual precipitation amounts at normal levels, occurred during 30 years (71.43%) (table 3). The area experienced 5 drought growing seasons (11.90%) (table 6) and 7 wet growing seasons (16.67%) (table 7). Growing- season precipitation amounts at normal levels occurred during 30 years (71.43%) (table 3). The 6-year period (1987-1992) was a long period with near-drought conditions. The average annual precipitation for these 6 years was 12.12 inches (307.89 mm), only 71.04% of the long-term mean. The average growing-season precipitation for the 6- year period was 9.97 inches (253.11 mm), only 69.19% of the long-term mean (table 3).
Water Deficiency
Monthly periods with water deficiency conditions are identified on the annual ombrothermic graphs when the precipitation data bar drops below the temperature data curve. On the ombrothermic graphs, periods during which plants are under low-temperature stress are indicated when the temperature curve drops below the freezing mark of 0.0o C (32.0o F). The long-term ombrothermic graph for the DREC Ranch (figure 2) shows that near water deficiency conditions exist for August, September, and October. This finding indicates that range plants generally may have a difficult time growing and accumulating herbage biomass during these 3 months. Favorable water relations occur during May, June, and July, a condition indicating that range plants should be able to grow and accumulate herbage biomass during these 3 months.
The ombrothermic relationships for the Dickinson Research Extension Center Ranch in western North Dakota are shown for each month in table 8. The 42-year period (1982 to 2023) had a total of 252 months during the growing season. Of these growing-season months, 75.0 months had water deficiency conditions, which indicates that range plants were under water stress during 29.8% of the growing-season months (tables 8 and 9): this amounts to an average of 2.0 months during every 6.0-month growing season range plants have been limited in growth and herbage biomass accumulation because of water stress. The converse indicates that only 4.0 months of an average year have conditions in which plants can grow without water stress.
Most growing seasons have months with water deficiency conditions. In only 6 of the 42 years (table 8) did water deficiency conditions not occur in any of the six growing-season months. In each growing-season month of 1982, 2013, 2015, 2016, 2019, and 2023, the amounts and distribution of the precipitation were adequate to prevent water stress in plants. Twenty years (47.62%) had water deficiency for 0.5 to 2.0 months during the growing season. Fifteen years (35.71%) had water deficiency conditions for 2.5 to 4.0 months during the growing season. One year (2.38%), 1988, had water deficiency conditions for 5.0 months during the growing season. None of the 42 years had water deficiency conditions for all 6.0 months of the growing season (table 8). The 6-year period (1987-1992) was a long period with low precipitation; during this period, water deficiency conditions existed for an average of 3.1 months during each growing season, which amounts to 51.33% of this period’s growing-season months (table 8).
May, June, and July are the 3 most important precipitation months and therefore constitute the primary period of production for range plant communities. May and June are the 2 most important months for dependable precipitation. Only 4 (9.52%) of the 42 years had water deficiency conditions during May, and 6 years (14.29%) had water deficiency conditions during June. One year (2017) had water deficiency conditions in both May and June. Fourteen (33.33%) of the 42 years had water deficiency conditions in July (table 9). Only one year (2017) has had water deficiency conditions during May, June, and July (table 8b).
Most of the growth in range plants occurs in May, June, and July (Goetz 1963, Manske 1994b). Peak aboveground herbage biomass production usually occurs during the last 10 days of July, a period that coincides with the time when plants have attained 100% of their growth in height (Manske 1994b). Range grass growth coincides with the 3- month period of May, June, and July, when 47.13% of the annual precipitation occurs.
August, September, and October are not dependable for positive water relations. August and September had water deficiency conditions in 45.24% and 52.38% of the years, respectively, and October had water deficiency conditions in 33.33% of the years (table 9). Visual observations of range grasses with wilted, senescent leaves in August indicate that most plants experience some level of water stress when conditions approach those of water deficiency. August, September, and/or October had water deficiency conditions during 80.95% of the growing seasons in the previous 42 years (table 8). These 3 months make up 42% of the growing season, and they had water deficiency conditions on the average of 44% of the time (table 9). The water relations in August, September, and October limit range plant growth and herbage biomass accumulation.
Over the last 42 years, drought years occurred 11.9% of the time. Drought growing seasons occurred 11.9% of the time. Water deficiency months occurred 29.8% of the time. Water deficiency occurred in May and June 9.5% and 14.3% of the time, respectively. July had water deficiency conditions 33.3% of the time. August, September, and October had water deficiency conditions 45.2%, 52.4%, and 33.3%. Water deficiency periods lasting for a month place plants under water stress severe enough to reduce herbage biomass production. These levels of wat4r stress are a major factor limiting the quantity and quality of plant growth in western North Dakota and can limit livestock production if not considered during the development and implementation of long-term grazing management strategies.
The ombrothermic procedure to identify growing season months with water deficiency treats each month as an independent event. Precipitation during the other months of the year may buffer or enhance the degree of water stress experienced by perennial plants during water deficiency months. The impact of precipitation during other months on the months with water deficiency can be evaluated from annual running total precipitation data (table 10). Water deficiency conditions occurred during 0.0 months in 2023 (table 10).
Conclusion
The vegetation in a region is a result of the total effect of the long-term climatic factors for that region. Ecologically, the most important climatic factors that affect rangeland plant growth are light, temperature, water (precipitation), and water deficiency.
Light is the most important ecological factor because it is necessary for photosynthesis. Changes in time of year and time of day coincide with changes in the angle of incidence of the sun’s rays; these changes cause variations in light intensity. Daylight duration oscillation for each region is the same every year and changes with the seasons. Shading of sunlight by cloud cover and from other plants affects plant growth. Day-length period is important to plant growth because it functions as a trigger to physiological processes. Most cool-season plants reach flower phenophase between mid May and mid June. Most warm-season plants flower between mid June and mid September.
Plant growth is limited by both low and high temperatures and occurs within only a narrow range of temperatures, between 32o and 122o F. Perennial plants have a 6-month growing season, between mid April and mid October. Diurnal temperature fluctuations of warm days and cool nights are beneficial for plant growth. Cool- season plants have lower optimum temperatures for photosynthesis than do warm-season plants, and cool-season plants do not use water as efficiently as do warm-season plants. Temperature affects evaporation rates, which has a dynamic effect on the annual ratios of cool-season to warm-season plants in the plant communities. A mixture of cool- and warm-season plants is highly desirable because the grass species in a mixture of cool- and warm-season species have a wide range of different optimum temperatuires amd the herbage biomass production is more stable over wide variations in seasonal temperatures.
Water is essential for living systems. Average annual precipitation received at the DREC Ranch is 17.1 inches, with 84.5% occurring during the growing season and 47.1% occurring in May, June, and July. Plant water stress occurs when the rate of water loss through transpiration exceeds the rate of replacement by absorption. Years with drought conditions have occurred 11.9% of the time during the past 42 years. Growing seasons with drought conditions have occurred 11.9% of the time.
Water deficiencies exist when the amount of rainfall received is less than evapotranspiration demand. Temperature and precipitation data can be used in ombrothermic graphs to identify monthly periods with water deficiencies. During the past 42 years, 29.8% of the growing-season months had water deficiency conditions that placed range plants under water stress: range plants were limited in growth and herbage biomass accumulation for an average of 2.0 months during every 6-month growing season. May, June, and July had water deficiency conditions 9.5%, 14.3%, and 33.3% of the time, respectively. August, September, and October had water deficiency conditions 45.2%, 52.4% and 33.3% of the time, respectively. One month with water deficiency conditions causes plants to experience water stress severe enough to reduce herbage biomass production.
Most of the growth in range grasses occurs in May, June, and July. In western North Dakota, 100% of range grass leaf growth in height and 86% to 100% of range flower stalk growth in height are completed by 30 July. Peak aboveground herbage biomas production usually occurs during the last 10 days of July, a period that coincides with the time during which plants are attaining 100% of their height. Most range grass growth occurs during the 3- month period of May, June, and July, when 47.1% of the annual precipitation occurs.
Grassland management should be based on phenological growth stages of the major grasses and can be planned by calendar date. Management strategies for a region should consider the climatic factors that affect and limit range plant growth.
Acknowledgment
I am grateful to Sheri Schneider for assistance in processing the weather data, compilation of the tables and figures, and production of this manuscript.
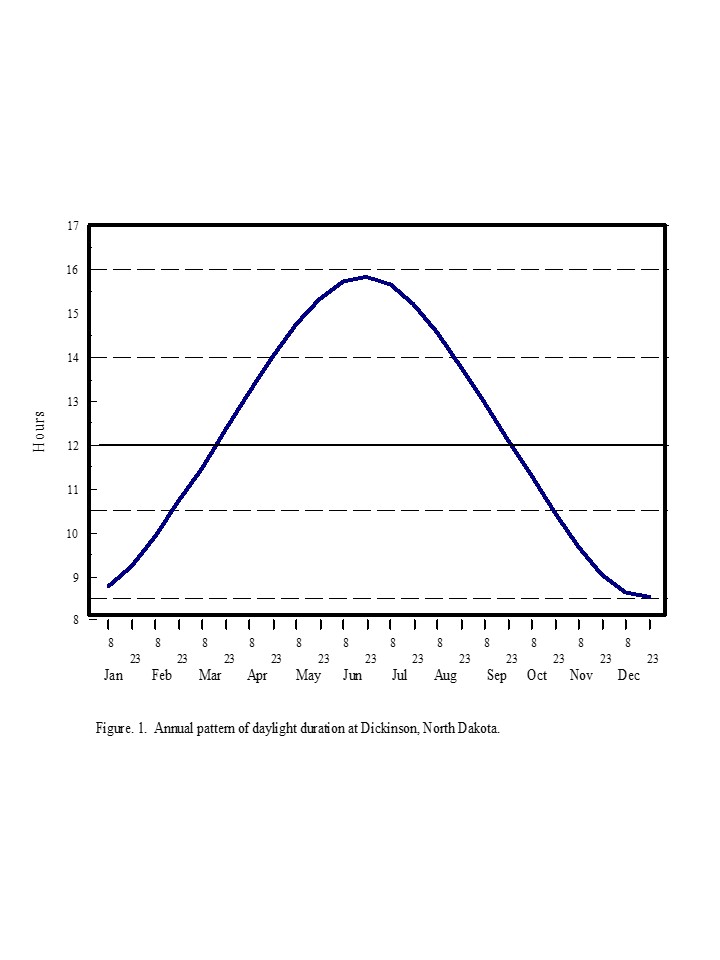
| Table 1. Long-term mean monthly temperature and monthly precipitation, 1982-2023. | ||||||||
| o F | o C | in. | mm | |||||
| Jan | 15.01 | -9.44 | 0.43 | 10.8 | ||||
| Feb | 18.11 | -7.71 | 0.43 | 11.04 | ||||
| Mar | 29.14 | -1.59 | 0.76 | 19.26 | ||||
| Apr | 41.17 | 5.09 | 1.42 | 36.03 | ||||
| May | 53.57 | 11.99 | 2.66 | 67.48 | ||||
| Jun | 63.34 | 17.41 | 3.04 | 77.32 | ||||
| Jul | 69.68 | 20.94 | 2.34 | 59.36 | ||||
| Aug | 68.44 | 20.24 | 1.99 | 50.47 | ||||
| Sep | 56.63 | 14.11 | 1.62 | 41.16 | ||||
| Oct | 43.74 | 6.52 | 1.34 | 34.14 | ||||
| Nov | 29.24 | -1.53 | 0.55 | 13.96 | ||||
| Dec | 18.24 | -7.64 | 0.48 | 12.31 | ||||
| MEAN | TOTAL | |||||||
| 42.19 | 5.7 | 17.06 | 433.33 | |||||
| Table 2. Seasonal precipitation distribution, 1982-2023. | ||
| Season | in. | % |
| Winter (Jan, Feb, Mar) | 1.62 | 9.5 |
| Spring (Apr, May, Jun) | 7.12 | 41.74 |
| Summer (Jul, Aug, Sep) | 5.95 | 34.88 |
| Fall (Oct, Nov, Dec) | 2.37 | 13.89 |
| TOTAL | 17.06 | |
| Table 3. Precipitation in inches and percent of long-term mean for perennial plant growing season months, 1982-2023. | |||||||||
| Growing Season | Annual Total | ||||||||
| Apr | May | Jun | Jul | Aug | Sep | Oct | |||
| Long-Term Mean | |||||||||
| 1.42 | 2.66 | 3.04 | 2.34 | 1.99 | 1.62 | 1.34 | 14.41 | 17.06 | |
| 1982-2023 | |||||||||
| 1982 | 1.37 | 2.69 | 4.3 | 3.54 | 1.75 | 1.69 | 5.75 | 21.09 | 25.31 |
| % of LTM | 96.48 | 101.13 | 141.45 | 151.28 | 87.94 | 104.32 | 429.1 | 146.38 | 148.36 |
| 1983 | 0.21 | 1.53 | 3.26 | 2.56 | 4.45 | 0.86 | 0.72 | 13.59 | 15.55 |
| % of LTM | 14.79 | 57.52 | 107.24 | 109.4 | 223.62 | 53.09 | 53.73 | 94.32 | 91.15 |
| 1984 | 2.87 | 0 | 5.3 | 0.11 | 1.92 | 0.53 | 0.96 | 11.69 | 12.88 |
| % of LTM | 202.11 | 0 | 174.34 | 4.7 | 96.48 | 32.72 | 71.64 | 81.14 | 75.5 |
| 1985 | 1.24 | 3.25 | 1.58 | 1.07 | 1.84 | 1.69 | 2.13 | 12.8 | 15.13 |
| % of LTM | 87.32 | 122.18 | 51.97 | 45.73 | 92.46 | 104.32 | 158.96 | 88.84 | 88.69 |
| 1986 | 3.13 | 3.68 | 2.58 | 3.04 | 0.46 | 5.29 | 0.18 | 18.36 | 22.96 |
| % of LTM | 220.42 | 138.35 | 84.87 | 129.91 | 23.12 | 326.54 | 13.43 | 127.43 | 134.6 |
| 1987 | 0.1 | 1.38 | 1.15 | 5.39 | 2.65 | 0.78 | 0.08 | 11.53 | 14.13 |
| % of LTM | 7.04 | 51.88 | 37.83 | 230.34 | 133.17 | 48.15 | 5.97 | 80.03 | 82.83 |
| 1988 | 0 | 1.85 | 1.7 | 0.88 | 0.03 | 0.73 | 0.11 | 5.3 | 9.03 |
| % of LTM | 0 | 69.55 | 55.92 | 37.61 | 1.51 | 45.06 | 8.21 | 36.79 | 52.93 |
| 1989 | 2.92 | 1.73 | 1.63 | 1.3 | 1.36 | 0.7 | 0.96 | 10.6 | 13.07 |
| % of LTM | 205.63 | 65.04 | 53.62 | 55.56 | 68.34 | 43.21 | 71.64 | 73.57 | 76.61 |
| 1990 | 2.03 | 2.39 | 3.75 | 1.13 | 0.31 | 0.68 | 0.85 | 11.14 | 11.97 |
| % of LTM | 142.96 | 89.85 | 123.36 | 48.29 | 15.58 | 41.98 | 63.43 | 77.32 | 70.16 |
| 1991 | 1.97 | 1.16 | 3.95 | 1.43 | 0.55 | 2.17 | 1.31 | 12.54 | 13.3 |
| % of LTM | 138.73 | 43.61 | 129.93 | 61.11 | 27.64 | 133.95 | 97.76 | 87.04 | 77.96 |
| 1992 | 0.81 | 0.68 | 1.59 | 2.7 | 2.02 | 0.72 | 0.16 | 8.68 | 11.23 |
| % of LTM | 57.04 | 25.56 | 52.3 | 115.38 | 101.51 | 44.44 | 11.94 | 60.24 | 65.83 |
| 1993 | 1.41 | 1.71 | 4.57 | 5.1 | 1.24 | 0.18 | 0.05 | 14.26 | 17.36 |
| % of LTM | 99.3 | 64.29 | 150.33 | 217.95 | 62.31 | 11.11 | 3.73 | 98.97 | 101.76 |
| 1994 | 0.86 | 1.46 | 4.51 | 1.07 | 0.31 | 1.08 | 4.58 | 13.87 | 16.14 |
| % of LTM | 60.56 | 54.89 | 148.36 | 45.73 | 15.58 | 66.67 | 341.79 | 96.27 | 94.61 |
| Table 3 (cont). Precipitation in inches and percent of long-term mean for perennial plant growing season months, | ||||||||||
| 1982- 2023. | ||||||||||
| Growing Season | Annual Total | |||||||||
| Apr | May | Jun | Jul | Aug | Sep | Oct | ||||
| Long-Term Mean | ||||||||||
| 1.42 | 2.66 | 3.04 | 2.34 | 1.99 | 1.62 | 1.34 | 14.41 | 17.06 | ||
| 1982-2023 | ||||||||||
| 1995 | 1.01 | 4.32 | 0.68 | 4.62 | 3.16 | 0 | 0.67 | 14.46 | 16.24 | |
| % of LTM | 71.13 | 162.41 | 22.37 | 197.44 | 158.79 | 0 | 50 | 100.36 | 95.19 | |
| 1996 | 0.14 | 3.07 | 1.86 | 2.55 | 1.72 | 2.51 | 0.09 | 11.94 | 15.97 | |
| % of LTM | 9.86 | 115.41 | 61.18 | 108.97 | 86.43 | 154.94 | 6.72 | 82.87 | 93.61 | |
| 1997 | 2.89 | 0.95 | 5.02 | 5.41 | 0.76 | 1.75 | 0.78 | 17.56 | 18.61 | |
| % of LTM | 203.52 | 35.71 | 165.13 | 231.2 | 38.19 | 108.02 | 58.21 | 121.88 | 109.09 | |
| 1998 | 0.4 | 1.51 | 5.98 | 2.11 | 4.6 | 0.71 | 4.38 | 19.69 | 22.42 | |
| % of LTM | 28.17 | 56.77 | 196.71 | 90.17 | 231.16 | 43.83 | 326.87 | 136.66 | 131.42 | |
| 1999 | 1.1 | 4.93 | 1.59 | 1.8 | 2.7 | 2.4 | 0 | 14.52 | 15.56 | |
| % of LTM | 77.46 | 185.34 | 52.3 | 76.92 | 135.68 | 148.15 | 0 | 100.78 | 91.21 | |
| 2000 | 1.26 | 1.9 | 3.77 | 2.77 | 2.74 | 1.09 | 1.46 | 14.99 | 20.23 | |
| % of LTM | 88.73 | 71.43 | 124.01 | 118.38 | 137.69 | 67.28 | 108.96 | 104.04 | 118.58 | |
| 2001 | 2.7 | 0.53 | 6.36 | 4.87 | 0 | 1.94 | 0 | 16.4 | 18.03 | |
| % of LTM | 190.14 | 19.92 | 209.21 | 208.12 | 0 | 119.75 | 0 | 113.83 | 105.69 | |
| 2002 | 1.14 | 2.18 | 5.4 | 4.27 | 4.24 | 0.74 | 0.88 | 18.85 | 21.88 | |
| % of LTM | 80.28 | 81.95 | 177.63 | 182.48 | 213.07 | 45.68 | 65.67 | 130.83 | 128.25 | |
| 2003 | 1.3 | 4.34 | 1.42 | 2.03 | 0.82 | 2.37 | 0.74 | 13.02 | 19.12 | |
| % of LTM | 91.55 | 163.16 | 46.71 | 86.75 | 41.21 | 146.3 | 55.22 | 90.37 | 112.07 | |
| 2004 | 0.89 | 1.31 | 1.65 | 2.3 | 0.93 | 2.57 | 3.1 | 12.75 | 16.51 | |
| % of LTM | 62.68 | 49.25 | 54.28 | 98.29 | 46.73 | 158.64 | 231.34 | 88.49 | 96.78 | |
| 2005 | 0.96 | 6.01 | 6.05 | 0.6 | 1.52 | 0.5 | 1.96 | 17.6 | 21.51 | |
| % of LTM | 67.61 | 225.94 | 199.01 | 25.64 | 76.38 | 30.86 | 146.27 | 122.16 | 126.08 | |
| 2006 | 2.78 | 2.82 | 2.13 | 0.96 | 2.87 | 1.42 | 2.01 | 14.99 | 17.7 | |
| % of LTM | 195.77 | 106.02 | 70.07 | 41.03 | 144.22 | 87.65 | 150 | 104.04 | 103.75 | |
| 2007 | 1.58 | 4.64 | 1.8 | 1.05 | 0.78 | 0.76 | 0.26 | 10.87 | 13.94 | |
| % of LTM | 111.27 | 174.44 | 59.21 | 44.87 | 39.2 | 46.91 | 19.4 | 75.44 | 81.71 | |
| Table 3 (cont). Precipitation in inches and percent of long-term mean for perennial plant growing season months, | |||||||||
| 1982- 2023. | |||||||||
| Growing Season | Annual Total | ||||||||
| Apr | May | Jun | Jul | Aug | Sep | Oct | |||
| Long-Term Mean | |||||||||
| 1.42 | 2.66 | 3.04 | 2.34 | 1.99 | 1.62 | 1.34 | 14.41 | 17.06 | |
| 1982-2023 | |||||||||
| 2008 | 0.61 | 2.79 | 4.02 | 1.06 | 1.02 | 1.04 | 1.68 | 12.22 | 14.88 |
| % of LTM | 42.96 | 104.89 | 132.24 | 45.3 | 51.26 | 64.2 | 125.37 | 84.81 | 87.22 |
| 2009 | 1.49 | 2.47 | 3.84 | 3.24 | 0.95 | 1.15 | 1.95 | 15.09 | 17.89 |
| % of LTM | 104.93 | 92.86 | 126.32 | 138.46 | 47.74 | 70.99 | 145.52 | 104.73 | 104.86 |
| 2010 | 1.43 | 3.7 | 3.5 | 1.94 | 1.39 | 4.09 | 0.13 | 16.18 | 19.03 |
| % of LTM | 100.7 | 139.1 | 115.13 | 82.91 | 69.85 | 252.47 | 9.7 | 112.3 | 111.55 |
| 2011 | 1.66 | 6.87 | 2.15 | 2.33 | 2.7 | 1.76 | 0.44 | 17.91 | 21.28 |
| % of LTM | 116.9 | 258.27 | 70.72 | 99.57 | 135.68 | 108.64 | 32.84 | 124.31 | 124.74 |
| 2012 | 2.38 | 1.58 | 4.31 | 1.98 | 0.82 | 0.21 | 2.35 | 13.63 | 15.46 |
| % of LTM | 167.61 | 59.4 | 141.78 | 84.62 | 41.21 | 12.96 | 175.37 | 94.6 | 90.62 |
| 2013 | 1.05 | 7.55 | 2.23 | 2.13 | 2.81 | 2.44 | 3.35 | 21.56 | 23.22 |
| % of LTM | 73.94 | 283.83 | 73.36 | 91.03 | 141.21 | 150.62 | 250 | 149.64 | 136.11 |
| 2014 | 1.41 | 3.73 | 3.38 | 0.37 | 8.84 | 1.03 | 0.59 | 19.35 | 21.11 |
| % of LTM | 99.3 | 140.23 | 111.18 | 15.81 | 444.22 | 63.58 | 44.03 | 134.3 | 123.74 |
| 2015 | 0.6 | 1.65 | 4.68 | 2.87 | 1.69 | 1.35 | 1.96 | 14.8 | 17.01 |
| % of LTM | 42.25 | 62.03 | 153.95 | 122.65 | 84.92 | 83.33 | 146.27 | 102.72 | 99.71 |
| 2016 | 3.44 | 2.26 | 1.96 | 3.61 | 1.86 | 2.66 | 1.8 | 17.59 | 19.7 |
| % of LTM | 242.25 | 84.96 | 64.47 | 154.27 | 93.47 | 180.95 | 134.33 | 122.09 | 115.47 |
| 2017 | 1.3 | 0.84 | 1.27 | 0.72 | 2.67 | 2.28 | 0.08 | 9.16 | 10.55 |
| % of LTM | 91.55 | 31.58 | 41.78 | 30.77 | 134.17 | 140.74 | 5.97 | 63.58 | 61.84 |
| 2018 | 0.48 | 1.22 | 4.23 | 2.01 | 0.55 | 1.84 | 0.66 | 10.99 | 14.39 |
| % of LTM | 33.8 | 45.86 | 139.14 | 85.9 | 27.64 | 113.58 | 49.25 | 76.28 | 84.35 |
| 2019 | 1.35 | 2.52 | 2.6 | 1.61 | 4.7 | 9.1 | 1.26 | 23.14 | 25.88 |
| % of LTM | 95.07 | 94.74 | 85.53 | 68.8 | 236.18 | 561.73 | 94.03 | 160.61 | 151.7 |
| 2020 | 0.59 | 1.45 | 1.1 | 2.67 | 2.56 | 0.86 | 0.26 | 9.49 | 11.01 |
| % of LTM | 41.55 | 54.51 | 36.18 | 114.1 | 128.64 | 53.09 | 19.4 | 65.87 | 64.54 |
| Table 3 (cont). Precipitation in inches and percent of long-term mean for perennial plant growing season | |||||||||
| months, 1982- 2023. | |||||||||
| Growing Season | Annual Total | ||||||||
| Apr | May | Jun | Jul | Aug | Sep | Oct | |||
| Long-Term Mean | |||||||||
| 1.42 | 2.66 | 3.04 | 2.34 | 1.99 | 1.62 | 1.34 | 14.41 | 17.06 | |
| 1982-2023 | |||||||||
| 2021 | 0.26 | 5.07 | 1.07 | 1.03 | 1.63 | 0.14 | 2.7 | 11.9 | 13.75 |
| % of LTM | 18.31 | 190.6 | 35.2 | 44.02 | 81.91 | 8.64 | 201.49 | 82.59 | 80.6 |
| 2022 | 4.16 | 3.17 | 2.02 | 3.71 | 0.28 | 0.93 | 1.84 | 16.11 | 20.16 |
| % of LTM | 292.96 | 119.17 | 66.45 | 158.55 | 14.07 | 57.41 | 137.31 | 111.81 | 118.17 |
| 2023 | 0.3 | 2.69 | 1.91 | 2.21 | 3.25 | 1.32 | 1.24 | 12.92 | 15.42 |
| % of LTM | 21.13 | 101.13 | 62.83 | 94.44 | 163.32 | 81.48 | 92.54 | 89.67 | 90.39 |
Table 4. Years with annual precipitation amounts of 75% or less of the long-term mean (LTM). Year %LTM
|
|---|
Table 6. Years with growing-season precipitation amounts of 75% or less of the long-term mean (LTM).
| ||||||||||||||||||
|---|---|---|---|---|---|---|---|---|---|---|---|---|---|---|---|---|---|---|
Table 7. Years with growing-season precipitation amounts of 125% or more of the long-term mean (LTM). Year %LTM
|
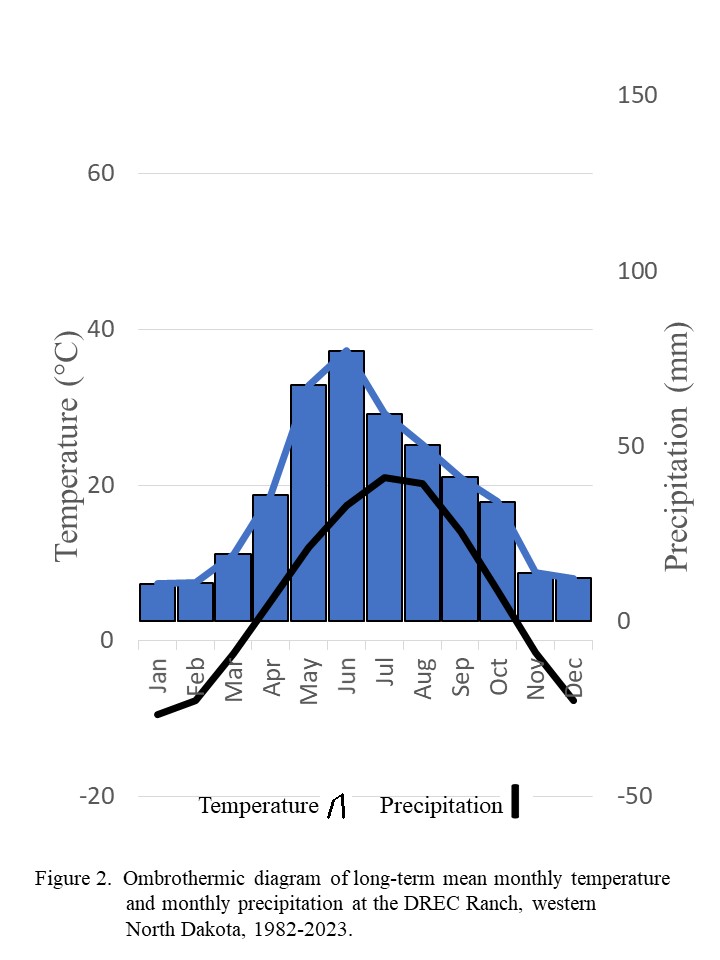
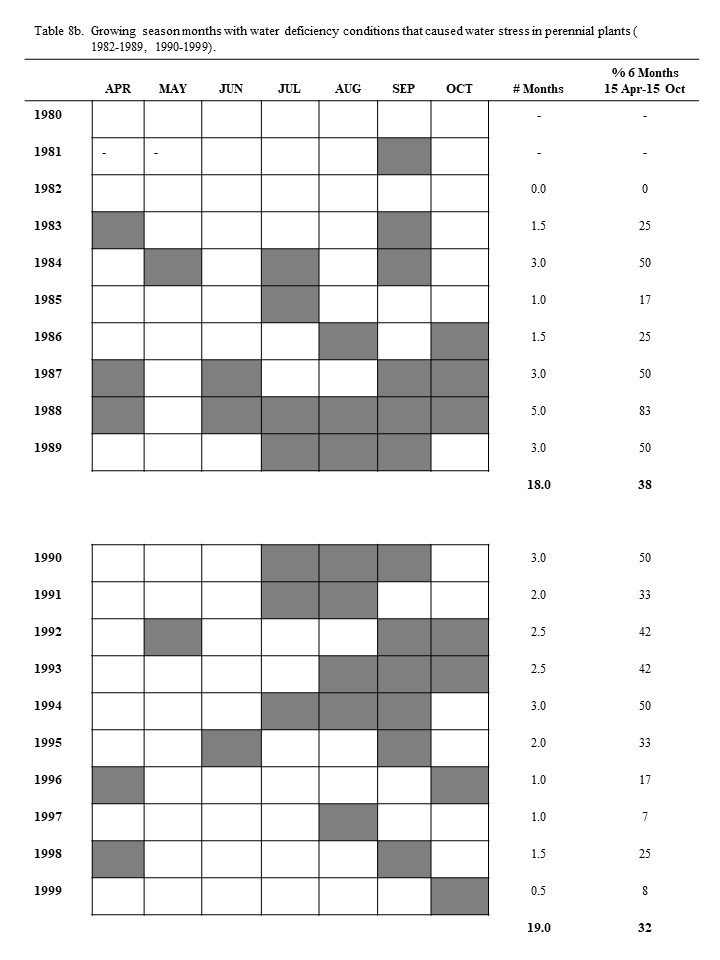
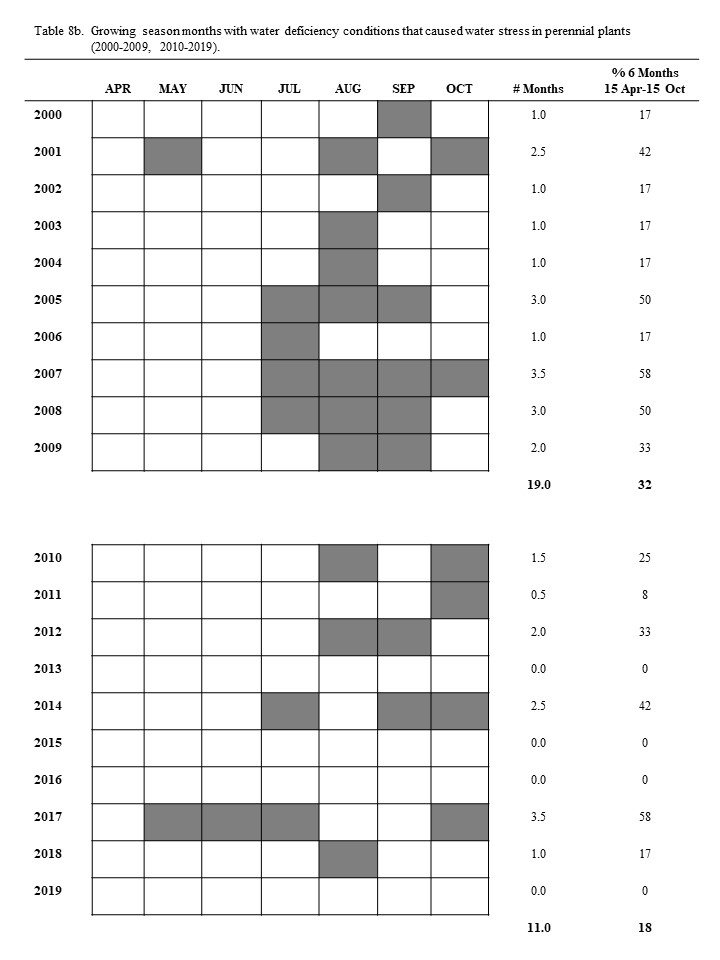
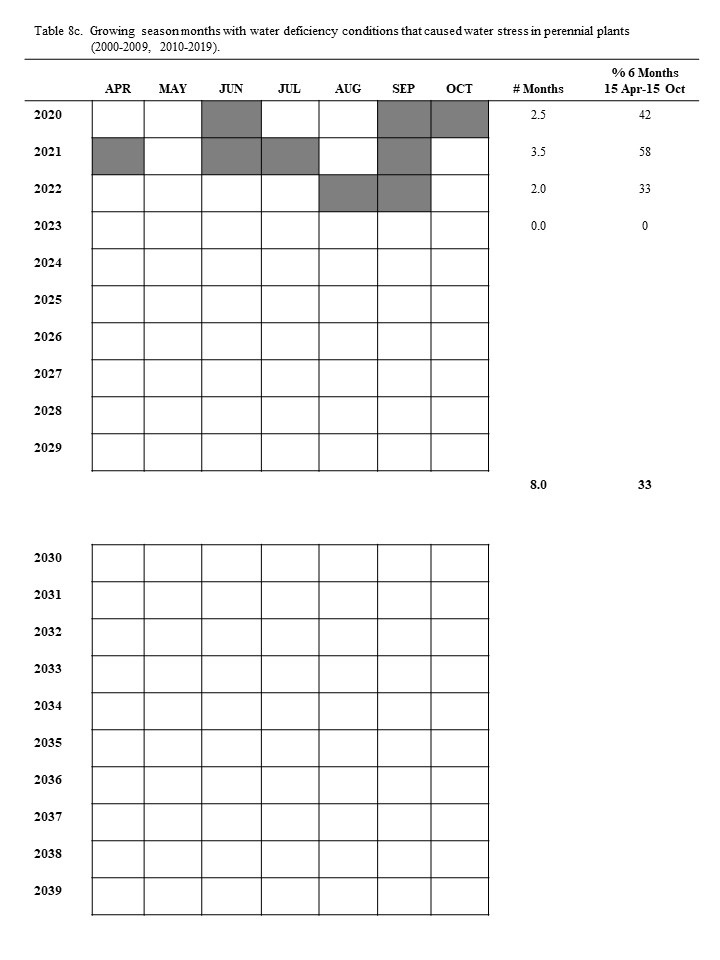
| Table 9. Growing season months with water deficiency, 1982-2023. | |||||||||
| APR | MAY | JUN | JUL | AUG | SEP | OCT | # Months | % 6 Months 15 Apr-15 Oct | |
| TOTAL | 6 | 4 | 6 | 14 | 19 | 22 | 14 | 75 | 29.8 |
| % of 42 YEARS | 14.3 | 9.5 | 14.3 | 33.3 | 45.2 | 52.4 | 33.3 | ||
| Table 10. Monthly precipit+A1:L47+A1:M44ation and running total precipitation compared to the long-term mean (LTM), 2023. | ||||||
| Monthly Precipitation (in) | ||||||
| Months | LTM 1982-2022 | Precipitaton 2023 | % of LTM | Running Total 1982-2022 | Running Precipitation 2023 | % of LTM |
| Jan | 0.43 | 0.33 | 76.74 | 0.43 | 0.33 | 76.74 |
| Feb | 0.44 | 0.25 | 56.82 | 0.87 | 0.58 | 66.67 |
| Mar | 0.73 | 1.78 | 243.84 | 1.6 | 2.36 | 147.5 |
| Apr | 1.45 | 0.3 | 20.69 | 3.05 | 2.66 | 87.21 |
| May | 2.66 | 2.69 | 101.13 | 5.71 | 5.35 | 93.7 |
| Jun | 3.07 | 1.91 | 62.22 | 8.78 | 7.26 | 82.69 |
| Jul | 2.34 | 2.21 | 94.44 | 11.12 | 9.47 | 85.16 |
| Aug | 1.96 | 3.25 | 165.82 | 13.08 | 12.72 | 97.25 |
| Sep | 1.63 | 1.32 | 80.98 | 14.71 | 14.04 | 95.45 |
| Oct | 1.35 | 1.24 | 91.85 | 16.06 | 15.28 | 95.14 |
| Nov | 0.56 | 0.02 | 3.57 | 1662 | 15.3 | 92.06 |
| Dec | 0.49 | 0.12 | 24.49 | 17.11 | 15.42 | 90.12 |
| Total | 17.11 | 15.42 | 90.12 | |||
Literature Cited
Barbour, M.G., J.H. Burk, and W.D. Pitts. 1987. Terrestrial plant ecology. The Benjamin/Cummings Publishing Co., Menlo Park, CA. 634p.
Barker, W.T., and W.C. Whitman. 1988. Vegetation of the Northern Great Plains. Rangelands 10:266-272.
Bluemle, J.P. 1977. The face of North Dakota: the geologic story. North Dakota Geological Survey. Ed. Series 11. 73p.
Bluemle, J.P. 1991. The face of North Dakota: revised edition. North Dakota Geological Survey. Ed. Series 21. 177p.
Brown, R.W. 1977. Water relations of range plants. Pages 97-140. in R.E. Sosebee (ed.) Rangeland plant physiology. Range Science Series No. 4. Society for Range Management. Denver, CO.
Brown, R.W. 1995. The water relations of range plants: adaptations to water deficits. Pages 291-413. in D.J. Bedunah and R.E. Sosebee (eds.). Wildland plants: physiological ecology and developmental morphology. Society for Range Management. Denver, CO.
Coyne, P.I., M.J. Trlica, and C.E. Owensby. 1995. Carbon and nitrogen dynamics in range plants. Pages 59-167. in D.J. Bedunah and R.E. Sosebee (eds.). Wildland plants: physiological ecology and developmental morphology. Society for Range Management. Denver, CO.
Dahl, B.E., and D.N. Hyder. 1977. Developmental morphology and management implications. Pages 257-290. in R.E. Sosebee (ed.). Rangeland plant physiology. Range Science Series No. 4. Society for Range Management. Denver, CO.
Dahl, B.E. 1995. Developmental morphology of plants. Pages 22-58. in D.J. Bedunah and R.E. Sosebee (eds.). Wildland plants: physiological ecology and developmental morphology. Society for Range Management. Denver, CO.
Daubenmire, R.F. 1974. Plants and environment. John Wiley and Sons. New York, NY. 422p.
Dickinson Research Center. 1982-2023. Temperature and precipitation weather data.
Emberger, C., H. Gaussen, M. Kassas, and A. dePhilippis. 1963. Bioclimatic map of the Mediterranean Zone, explanatory notes. UNESCO-FAO. Paris. 58p.
Goetz, H. 1963. Growth and development of native range plants in the mixed grass prairie of western North Dakota. M.S. Thesis, North Dakota State University, Fargo, ND. 165p.
Jensen, R.E. 1972. Climate of North Dakota. National Weather Service, North Dakota State University, Fargo, ND. 48p.
Langer, R.H.M. 1972. How grasses grow. Edward Arnold. London, Great Britain. 60p.
O. Olson. 1968. Soil survey of Stark County, North Dakota. U.S. Government Printing Office, Washington, DC. 116p.+ plates.
Leopold, A.C., and P.E. Kriedemann. 1975. Plant growth and development. McGraw-Hill Book Co. New York, NY. 545p.
Manske, L.L. 1994a. History and land use practices in the Little Missouri Badlands and western North Dakota. Proceedings- Leafy spurge strategic planning workshop. USDI National Park Service, Dickinson, ND. p. 3-16.
Manske, L.L. 1994b. Problems to consider when implementing grazing management practices in the Northern Great Plains. NDSU Dickinson Research Extension Center. Range Management Report DREC 94-1005, Dickinson, ND. 11p.
Manske, L.L. 1999. Prehistorical conditions of rangelands in the Northern Great Plains. NDSU Dickinson Research Extension Center. Summary Range Management Report DREC 99-3015, Dickinson, ND. 5p.
Manske, L.L. 2011. Range plant growth and development are affected by climatic factors. NDSU Dickinson Research Extension Center. Summary Range Management Report DREC 11-3019c, Dickinson, ND. 5p.
McMillan, C. 1957. Nature of the plant community. III. Flowering behavior within two grassland communities under reciprocal transplanting. American Journal of Botany 44 (2): 144-153.
National Weather Service. 1996. Sunrise and sunset time tables for Dickinson, North Dakota. National Weather Service, Bismarck, ND. 1p.
Odum, E.P. 1971. Fundamentals of ecology. W.B. Saunders Company. Philadelphia, PA. 574p.
Ramirez, J.M. 1972. The agroclimatology of North Dakota, Part 1. Air temperature and growing degree days. Extension Bulletin No. 15. North Dakota State University, Fargo, ND. 44p.
Roberts, R.M. 1939. Further studies of the effects of temperature and other environmental factors upon the photoperiodic response of plants. Journal of Agricultural Research 59(9): 699-709.
Shiflet, T.N. (ed.). 1994. Rangeland cover types. Society for Range Management. Denver, CO. 152p.
Weier, T.E., C.R. Stocking, and M.G. Barbour. 1974. Botany: an introduction to plant biology. John Wiley and Sons. New York, NY. 693p.
Agronomy Research
Surface Applied Lime Impacts on North Dakota No-till Soils
Chris Augustin
701-456-1100
Introduction
Soils become acidic from the mineralization of ammonium-based fertilizers. Hydrogen which causes acidity is released as the nitrogen fertilizer nitrifies into nitrate. No-till soils are particularly susceptible to acidification from the lack of mixing subsurface alkaline products and the tendency to apply ammonium-based fertilizers at or near the soil surface.
Soil pH controls chemical weathering and soil solution chemical activity. Phosphorus (P) and aluminum (Al) are two elements that greatly impact crop production and are dependent on soil pH. Phosphorus is most readily plant available when the soil pH is approximately six to seven. When soil pH is less than 5.5, Al becomes soluble, binds to P, and renders P unavailable to plants. Additionally, Al can have a toxic effect to plants that stunt and deform root growth and reduces seed germination. Free Al in the soil solution hydrolyzes water which further acidifies the soil. Soil pH less than 5.5 can reduce bacteria activity and increase nitrogen deficiencies.
Calcium-carbonate (lime) neutralizes acidity and is a common liming amendment. Agriculture lime is not readily available in North Dakota. However, a waste product of the sugarbeet refining process (SBWL) is comprised of lime.
Lime requirement recommendations have not been developed for North Dakota. This project investigated the impacts of surface applied SBWL on acidic no-till soils in North Dakota.
Methods
Twenty-four sites were established in the spring of 2021 and 2022. Soil pH at the 0-3 in depth was less than 5.5. Collaborating producers planted and managed their crop. Experimental design was a randomized complete block design with four replications. Hoops with a 36 in diameter were placed in the field and spaced at least 10 ft away from adjacent hoops. Soils were collected within 1 ft outside of the hoop. Soil was sampled by a hand probe at the 0-3, 3-6, and 0-6 in depths. Sugarbeet waste lime treatments were hand applied within the hoop after initial soil sampling. Treatments were 0, 0.5, 1, 2, 4, 8, and 16 tons lime/ac. The SBWL contained 0.6 lbs nitrate/ton, 5.2 lbs P/ton, 0.9 lbs potassium/ton, 75.5 % calcium carbonate equivalence, and 14% moisture.
Post-harvest, October/November, soil samples were collected by a hand probe within the hoop at the 0-3, 3-6, and 0-6 in depths. Soils were analyzed to determine soil pH impacts.
Results
All sugarbeet waste lime treatments increased the soil pH of the 0-3 and 0-6 in depths (Table 1), except for the 0.5 t/ac treatment. The regression analysis procedure produced statistically significant polynomial regressions for environments having a buffer pH of 5.9, 6.1, 6.3, 6.4, 6.5, 6.6, 6.7, 6.8, and 6.9 (Table 2). A stepwise regression procedure was used to fill in the gaps for the soil buffer pH of 6.0 and 6.2
Up to two tons of lime/ac reacted with the soil in one growing season. Future research will evaluate the lime recipe and assess lime application timing and application methods.
| Table 1. Beet lime impacts on soil pH by depth. | |||
|---|---|---|---|
| Treatment | Soil pH (inches) | ||
| Calcium Carbonate Effectiveness T/ac | 0-3 | 3-6 | 0-6 |
| 0 | 5.16c | 5.54 | 5.41c |
| 0.5 | 5.16c | 5.52 | 5.30cd |
| 1 | 5.31b | 5.52 | 5.40cd |
| 2 | 5.35b | 5.5 | 5.60b |
| 4 | 5.51a | 5.49 | 5.77a |
| 8 | 5.33b | 5.59 | 5.75a |
| 16 | 5.37ab | 5.5 | 5.73a |
| Variance | 0.213 | 0.213 | 0.126 |
| P-value | <.0001 | NS | <.0001 |
| Table 2. Tons of calcium carbonate equivalent needed to remediate acid soils at the 0-3 inch depth. | |||
|---|---|---|---|
| Buffer pH | Tons Calcium Carbonate Equivalent/acre for Desired Soil pH | ||
| Desired pH | 5.5 | 6 | 6.5 |
| ----------0-3 inch soil depth---------- | |||
| 5.9* | 3.6 | 5.1 | 6.6 |
| 6.0† | 1.8 | 5.7 | 9.9 |
| 6.1* | 2.2 | 3.2 | 4.1 |
| 6.2† | 4.6 | 5.3 | 7.7 |
| 6.3* | 3.4 | 4.7 | 6.1 |
| 6.4* | 2.9 | 6.6 | 12.2 |
| 6.5* | 1.4 | 4.2 | 9.4 |
| 6.6* | 2.9 | 6.2 | 11 |
| 6.7* | 1.8 | 4.5 | 6.8 |
| 6.8* | 0.7 | 1.8 | 4.5 |
| 6.9* | 0 | 0 | 3 |
| 7.0† | 0 | 0 | 1 |
| *Indicates statistically significant at the 0.05 level. | |||
| †Recommendations are based off of stepwise regression procedure. | |||
| We thank the North Dakota Wheat Commission, North Dakota Soybean Council, North Dakota Corn Council, and Northern Canola Growers Associaiton for their financial support to conduct this research! | |||
Soil Test 0-3 Inches to Pinpoint Acidity Acres Chris Augustin
Dickinson Research Extension Center
701-456-1100; chris.augustin@ndsu.edu
Introduction
Soil acidity is a soil health issue that reduces fertilizer efficiency through nutrient tie-up and aluminum toxicity. Aluminum toxicity further hinders plant growth and nutrient uptake by stunting and malforming root development. Nitrogen fertilizers mineralize into plant available nitrate. During the mineralization process, hydrogen is released and causes a localized zone of acidity.
Acid soil is corrected by applying a carbonate (lime) or other soil amendment that neutralizes the positively charged hydrogen ion. Lime is comprised of calcium-carbonate. Calcium does not neutralize soil acidity as calcium and hydrogen are positively charged soil cations and repel from each other. However, the carbonate in lime is negatively charged and produces water and carbon-dioxide when neutralizing hydrogen ions that cause soil acidity.
Having said that, the first step in managing soil acidity is to soil test. Whole field or composite soil testing will rarely render a good picture or truly show the status of your field since there is a dilution effect from the mixing of different soil types. Zone sampling a field will better pinpoint the acid acres in a given field.
Methods
This study compared the soil pH at the 0-6, 0-2, 2-4, 4-6, 0-3, and 3-6 inch depths at 12 different sites spread across North Dakota. Each research location had three replications. A total of 215 samples were analyzed. All collaborating producers were long-term no-tillers who applied nitrogen at the surface or a few inches into the soil. The producers reported that their soil acidity increased during the recent years.
Results
The lowest pH was observed at the 0-3 inch depth and was similar to the 0-2 inch depth (Figure 1). The 4-6 and 3-6 inch soil pH were the highest. This data suggests that the 0-3 inch soil test will more likely identify soil acidity issues. The 0-2 inch soil test was similar to the 0-3 inch soil test, but much more sampling is needed for the soil testing and adds a lot of time. Additionally, the 0-2 inch depth may not identify if an acidity hotspot is present as the pH was similar to the 0-6 inch soil test depth (Figure 1). Some large seeded crops such as field pea are planted deeper than two inches. The 0-2 inch depth doesn’t account for the soil environment around the deeper planted seeds whereas the 0-3 inch depth does.
Summary
Soil sampling depth impacts soil pH test results. Soil sampling at the 0-3 inch depth pinpoints the acidity acres when paired with precision soil sampling.
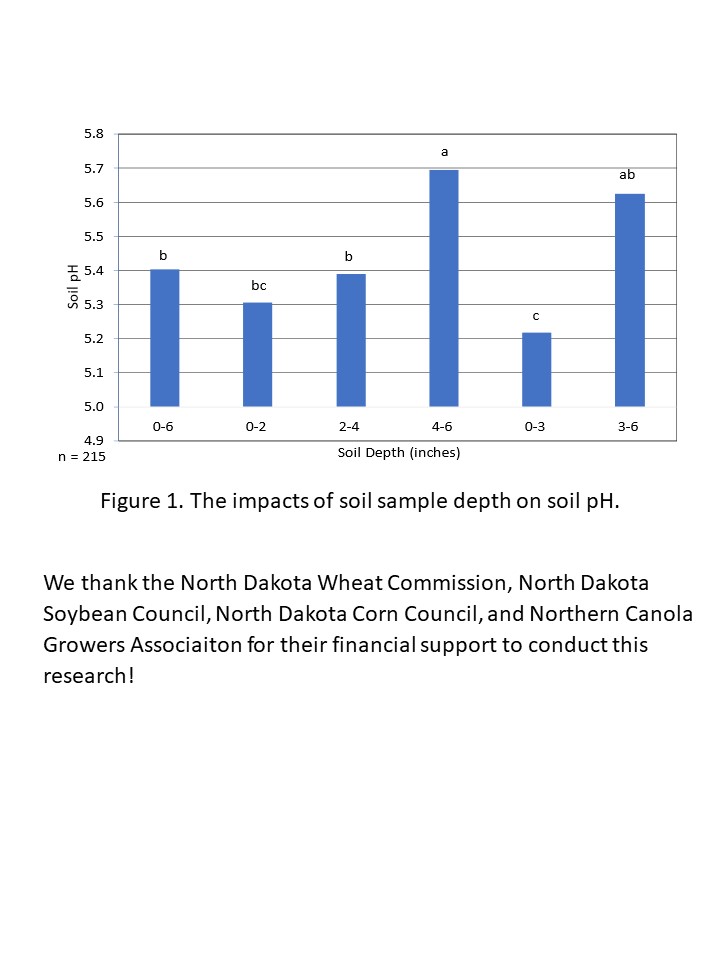
Phosphorus Fertilizer Impacts on Soybean Yield
Chris Augustin 701-456-1100 chris.augustin@ndsu.edu
Introduction
Soybean is a new crop for many west river farmers. Fertilizer trials are needed to help producers better manage their inputs. This project looked at the impact of phosphorus fertilizer on soybean yield at the Dickinson Research Extension Center.
Methods
The experimental location had an Olsen phosphorus test of 5 ppm and soil pH of 5.6. Triple Super Phosphate (0-46-0) was hand applied shortly after planting. Phosphorus treatments were 0, 23, 46, 69, and 92 lbs P2O5/ac. Plots were 30x10 ft with four replications. The middle five feet of each plot was harvested to reduce the impact of adjacent treatments. The soybean variety NDSU 17009GT was planted at 150,000 pls/a.
Results
Even though the initial phosphorus test of 5 ppm would be considered “low”, the phosphorus treatments did not impact soybean yield (Table 1). Many researchers have found soybean to be an efficient nutrient scavenger and phosphorus results are conflicting. More research on this will occur with multiple sites each year to develop a better understanding of soybean phosphorus management.
| Table 1. Phosphorus impacts on soybean yield. | |
|---|---|
| Phosphorus (lbs P2O5/ac) | Yield (bu/ac) |
| 0 | 16.4 |
| 23 | 18.5 |
| 46 | 16.6 |
| 69 | 18 |
| 92 | 18.3 |
| P-value | 0.24 |
| C.V. | 8.82 |
We thank the North Dakota Soybean Council for their financial support for this project!
Sulfate Fertility Impacts on Canola Grown in Southwest North Dakota
Chris Augustin 701-456-1100 chris.augustin@ndsu.edu
Introduction
Canola acres have significantly grown in southwest North Dakota. Sulfur has been found to be an essential nutrient of canola. Current NDSU recommendations are to apply 20 lbs of sulfate per acre in areas south and west of the Missouri River. This research is being conducted to assess sulfate fertilizer impacts on canola in the warmer and drier climate of southwest North Dakota.
The objectives of this research are to:
-Evaluate sulfur fertilizer rates on canola yield and quality.
-Evaluate different sulfur fertilizer sources on canola yield and quality.
Methods
Research was conducted at the NDSU-Dickinson Research Extension Center. Sulfate treatments were 0, 10, 20 and 30 lbs sulfate per acre. Fertilizer sources were ammonium sulfate (AMS), elemental sulfur (E-S), and gypsum (Gy). Nitrogen applications were 0, and 120 lbs of nitrogen per acre. Fertilizer treatments were hand applied shortly after canola was planted. Nitrogen fertilizer was urea. The plots that did not receive 120 lbs N/ac were supplemented with urea to equal the nitrogen amount from the 30 lbs AMS/ac treatment. The initial soil test was 35 lbs nitrogen/ac, 15 ppm phosphorus/ac, 278 ppm potassium/ac, 12 lbs sulfate/ac, 3.3% organic matter, and soil pH of 5.8. Canola was solid seeded on May 18 and fertilizer was hand applied the following day. Plots were 30x10 ft with four replications. The middle five feet of each plot was harvested with a plot combine to reduce the impact of adjacent treatments.
Results
Fertilizer treatments did impact yield (Table 1). However, it is difficult to distinguish a recommendation from one year of data. The AMS fertilizer produced the response curve with the greatest R2 value (Figure 1). This suggests that AMS was the most reliable sulfur fertilizer source. The R2 values of the gypsum and elemental sulfur curves were not statistically significant. We plan to continue this study to help you better manage your canola fertility program. More research is needed to draw a conclusion.
| Table 1. Fertilizer impacts on canola yield. | |
|---|---|
| Fertilizer Treatment* | Yield** |
| --------------lbs/ac--------------- | |
| 20 Gy | 734a |
| 20 AMS + 120 N | 724ab |
| 10 E-S + 120 N | 713ab |
| 10 AMS | 679ab |
| 30 AMS + 120 N | 677ab |
| 10 Gy + 120 N | 675ab |
| 20 E-sulfur | 663ab |
| 20 AMS | 663ab |
| 0S | 659ab |
| 30 AMS | 647ab |
| 30 E-S + 120 N | 646ab |
| 10 AMS + 120 N | 632ab |
| 0S + 120 N | 626ab |
| 30 E-S | 619ab |
| 30 Gy + 120 N | 617ab |
| 20 Gy + 120 N | 591b |
| 10 Gy | 581b |
| 30 Gy | 580b |
| 20 E-sulfur | 563b |
| 10 E-S + 120 N | 550b |
| 120 N Average | 656 |
| No Nitrogen Average | 627 |
| Plot Average | 641 |
| *Gypsum (Gy), Ammonium Sulfate (AMS), Elemental Sulfur (E-S) | |
| **Different letters indicate statistical differences at the 0.05 level. | |
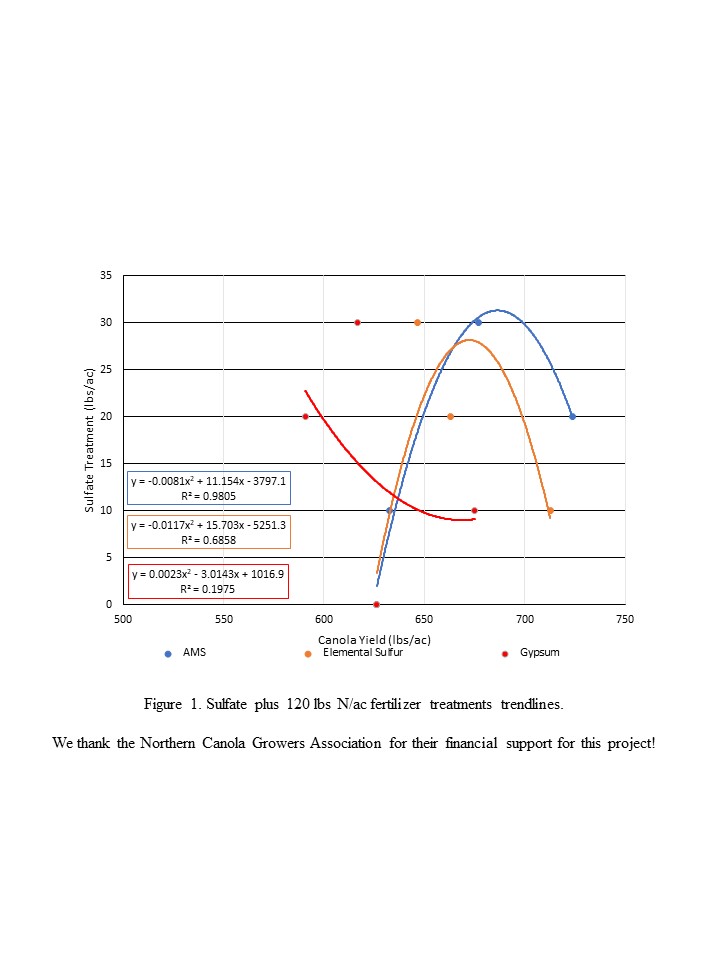
Sulfate Fertilizer Impacts on Wheat Yield
Chris Augustin chris.augustin@ndsu.edu 701-456-1100
Introduction
Sulfur is a micro-nutrient however, many are starting to condsider sulfur more so a macro-nutrient as the frequency of sulfur deficiencies have increased. The objective of this project is to help spring wheat producers better manage their sulfur fertilizer.
Methods
This is the first year of a multi-year/site research project. ND Vitpro was planted at a rate 1 million pls/ac on May 15. Plots were 10 x 25 ft with four replications. The middle five feet of each plot was harvested with a plot combine for data to reduce the impact of adjacent treatments. Fertilizer treatments were 0, 5, 10, 15, and 20 lbs sulfur/ac. Sulfur fertilizer sources were amonium sulfate (AMS), gypsum, and elemental sulfur (E-sulfur). Fertilizer was hand applied two days after planting. Plots were supplimented with urea and monammonium phosphate to equal 125 lbs nitrogen/ac and 20 lbs P2O5/ac respectively across all plots. The initial soil test was 49 lbs nitrogen/ac, 16 ppm Olsen phosphorus test, 276 ppm potassium, 10 lbs sulfur/ac, 3.2% organic matter, and soil pH of 5.5.
Results
Fertilizer treatments did impact spring wheat yield (Figure 1). However, conclusions are difficult to make with one growing season of data. Research does suggest that a fertilizer response is more likely with AMS than gypsum or E-sulfur. This is likely due to sulfur being more plant available from AMS versus gypsum or E-sulfur. This research will continue and results will be shared as the project progresses.
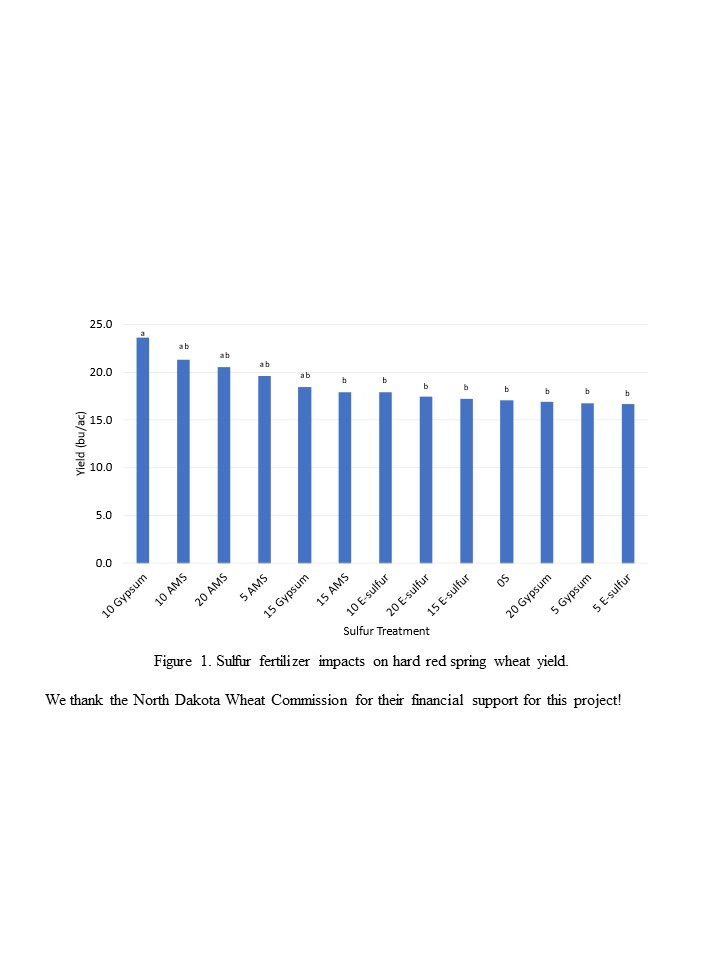
Livestock Research
Integrated Systems Single Timed-AI Heifer Development and
Non-Pregnant Heifer Finishing Profitability
Douglas G Landblom1, Songul Senturklu1,2, Lauren Hanna3, Bryon Parman4,
George Perry5, Steve Paisley6
1North Dakota State University, Dickinson Research Extension Center, Dickinson, ND
2Canakkale Onsekiz Mart University, Canakkale, Turkey
3North Dakota State University, Animal Science Department, Fargo, ND
4North Dakota State University, Department of Agribusiness and Applied Economics, Fargo, ND
5Texas A & M University, Agrilife Research, Overton, TX
6University of Wyoming, Sustainable Agricultural Research Extension Center, Lingle, WY
Research Brief:
Reproduction is the most profitable single management tool for the beef cattle enterprise. Heifers that become pregnant at the first service and calve early within the first 21 days of the calving season produce more pounds of beef compared to their later calving counterparts and have a greater probability of becoming pregnant early in subsequent breeding seasons (Burris and Priode, 1958). Moreover, heifers that calve early with their first calf have greater herd longevity and lifetime productivity compared to those that calve in the second 21 days or later (Cushman et al., 2013). In addition to the importance of pregnancy and early calving, accessing elite sires artificially ensures that replacement heifers have above average production opportunity due to genomic enhanced genetic potential.
Integrated crop-livestock beef cattle systems research at the NDSU-Dickinson Research Extension Center (DREC), has shown that regardless of steer frame score extended grazing of perennial and annual forages and delayed feedlot entry supported comparable meat quality and was consistently more profitable than feedlot control steers (Senturklu et al., 2018; 2019). This previous yearling steer grazing performance would be nutritionally supportive and is an ideal management system for replacement heifer development.
First service TAI using a 14-day Controlled Internal Drug Release® (CIDR-PGF2α-GnRH) program results in consistent pregnancy rates of 50-60% (Perry et al., 2012, 2015). A principal result from the use of progesterone delivered from a CIDR is to manipulate follicular waves by preventing the negative effect of premature PGF2α release from the uterus on corpus luteum survival (Patterson et al., 2019). For virgin heifers, a 14-d CIDR followed by PGF2α 16 d after CIDR removal and GnRH at the time of insemination 66 hr.±2hr after PGF2α has been a cost-effective timed artificial insemination (TAI) program. Moreover, using a single-TAI procedure produces heifers that are timed to calve early and the cost for keeping easy-calving heifer bulls year-around is eliminated.
The first objective for this long-term research and extension project is to evaluate reproductive performance of a traditional TAI program in which clean-up bulls are used after a single-TAI breeding and non-pregnant heifers are sold as feeder cattle after an 85-day pregnancy exam, and compare to a single-TAI program without cleanup bulls. Since cleanup bulls are not used, all non-pregnant heifers graze annual forages grown in multi-crop rotation and feedlot entry is delayed until fall and early-winter grazing has been completed. The finished heifers are marketed “in the meat” on a carcass grid basis.
The second project objective is to determine the combined economic value of bred heifers and the sale of open heifers compared to the combined value of bred heifers and carcass value of open heifers after finishing.
The third objective is to train students in estrous synchronization management techniques and cattle artificial insemination, and the fourth objective is to conduct a beef cattle producer heifer development survey comparing heifers developed in drylot to heifers developed in a pasture system.
Preliminary Results:
Year 1:
The project is designed to compare control heifers reared in drylot (DLOT) and fed hay and supplement to heifers managed grazing either native range (NR) or a combination of native range and annual forages (winter wheat, field pea-barley, corn, cover crop) grown in an integrated diverse annual forage cropping system (IAF), which are bred using a common single Timed-AI protocol (14d CIDR-PG-GnRH) and all non-pregnant heifers are finished for grid marketing. As such, following synchronization clean-up bulls are placed with the DLOT control heifers; however, there are no clean-up bulls placed with the grazing treatments.
Heifers in the study grazed native range and annual forages for a period of 121 days and during the period total gain per heifer was 74.3, 263.5, and 278.9 lb (P = 0.001), and synchronized timed-AI pregnancy rates were 59.4, 43.8, and 62.5% (P = 0.27) respectively, for the DLOT, IAF, and NR treatments. Total pregnancy rate of 90.6% in the drylot control group was significantly greater than the ANN forage group (43.8%), and the NR total pregnancy rate of 62.5% (P = 0.002) did not differ from either the DLOT or ANN treatment groups.
Grazing heifer feedlot performance for the IAF forage and NR had numerical differences; however, there was no measurable difference for starting weight (997 vs 961 lb, P = 0.29), ending weight (1,344 vs 1323 lb, P = 0.74), feedlot finishing gain (347 vs 362 lb, P = 0.69), ADG (3.13 vs 3.26 lb/day, P = 0.70), daily DM feed intake (33.13 vs 32.4 lb/day, P = 0.73), feed to gain ratio (10.66 vs 10.05 lb/day, P = 0.42), daily feed cost ($4.38 vs $4.30/day, P = .73), feed cost/lb gain ($1.41 vs $1.34, P = 0.51), and feed and yardage cost/lb gain ($1.55 vs $1.47, P = 0.55).
Non-pregnant grazing heifers from the IAF and NR treatments were harvested at the Cargill Meat Solutions federally inspected packing plant located in Ft. Morgan, Colorado. Similar to the feedlot heifer growth performance and efficiency data, grazing heifer carcass measurements did not differ between treatments for, HCW (814 vs 805 lb, P = 0.83), dressing pct (60.7 vs 61.0, P = 0.69), marbling score (524 vs 531, P = 0.78), and percent Choice/Prime (100% vs 100%).
Economic analysis for the DLOT, IAF and NR systems including a summary of expenses, income, net return, and margin between the drylot control, IAF, and NR systems is shown in Table 1. The expenses include heifer calf cost, mixed hay cost in the drylot confinement, 20% CP range cake, native range grazing cost for the IAF and NR systems, farming cost for the IAF system, AI expenses for semen, CIDR’s, prostaglandin (PGF2α), gonadotropin releasing hormone (GnRH), AI technician, breeding barn cost, clean-up bull depreciation (5-year property, straight line, half-year convention), finishing feed and yardage cost, and freight to the feedlot and packing plant.
All single-TAI heifer development systems’ net returns were profitable. However, the conventional DLOT control system heifers were the most profitable returning $459.25/heifer. Net returns for the IAF and NR systems were $221.15 and $327.54/heifer, respectively.
Year 2:
Heifers in the study grazed native range and annual forages for a period of 149 days and during the period total gain per heifer was 115.2, 226.2, and 191.8 lb (P = <0.001), and first service synchronized timed-AI pregnancy rates were 68.8, 46.9, and 34.4% (P = 0.016) respectively, for the DLOT, IAF, and NR treatments. Total pregnancy rate for the DLOT control group was 100.0%; however, in the IAF and NR groups where clean up bulls were not used total pregnancy rate was as previously stated: 46.9 and 34.4% respectively.
Grazing heifer feedlot performance for the IAF forage and NR were as follows for starting weight (1104 vs 1005 lb, P = 0.007), ending weight (1,477 vs 1330 lb, P = 0.004), feedlot finishing gain (315 vs 271 lb, P = 0.05), ADG (2.37 vs 2.04 lb/day, P = 0.06), daily DM feed intake (44.3 vs 44.2 lb/day, P = 0.98), feed to gain ratio (15.7 vs 18.1 lb/day, P = 0.11), daily feed cost ($4.36 vs $4.33/day, P = .94), feed cost/lb gain ($1.84 vs $2.12, P = 0.11), and feed and yardage cost/lb gain ($2.02 vs $2.33, P = 0.092).
Non-pregnant grazing heifers from the IAF and NR treatments were harvested at the Cargill Meat Solutions federally inspected packing plant located in Ft. Morgan, Colorado. Similar to the feedlot heifer growth performance and efficiency data, grazing heifer carcass measurements were as follows for HCW (834 vs 751 lb, P = 0.004), dressing pct (58.8 vs 58.8, P = 0.99), fat depth (0.60 vs 0.55-inch, P=0.29), marbling score (516 vs 519, P = 0.94), and percent Choice/Prime (100% vs 100%).
Economic analysis for the DLOT, IAF and NR systems including a summary of expenses, income, net return, and margin between the drylot control, IAF, and NR systems is shown in Table 2. The expenses include heifer calf cost, mixed hay cost in the drylot confinement, 20% CP range cake, native range grazing cost for the IAF and NR systems, farming cost for the IAF system, AI expenses for semen, CIDR’s, prostaglandin (PGF2α), gonadotropin releasing hormone (GnRH), AI technician, breeding barn cost, clean-up bull depreciation (5-year property, straight line, half-year convention), finishing feed and yardage cost, and freight to the feedlot and packing plant.
The second year of this single-TAI heifer development evaluation resulted in net returns were also profitable for all of the methods evaluated. Again, the conventional DLOT control system heifers were the most profitable returning $724.97/heifer. Net returns for the IAF and NR systems were $370.17 and $429.66/heifer, respectively.
For the integrated annual forage and native range grazing system, factors contributing to the lower annual forage net return were farming costs, finishing feed and yardage expense, and freight to the feedlot and packing plant. The lower native range system net return was attributed to feedlot feed and yardage expense plus freight cost to the feedlot and packing plant.
Since this heifer development systems research project includes multiple years of data collection, the systems’ net return may change as data from years three and four are added to the database.
Literature Cited:
Burris, M. J., and B. M. Priode. 1958. Effect of calving date on subsequent calving performance. J. Anim. Sci. 17:527-533. Doi:10.2527/jas1958. 173527x
Cushman, R. A., L. K. Kill, R. N. Funston, E. M. Mousel, and G. A. Perry. 2013. Heifer calving date positively influences calf weaning weights through six parturitions. J. Anim. Sci. 91:4486-4491.
Patterson, D. J., J. M. Thomas, J. W. C. Locke, E. R. Knickmeyer, R. C. Bonacker, and M. F. Smith. 2019. Control of estrus and ovulation in beef cows. Proceedings, Applied Reproductive Strategies in beef Cattle, August 20-21, 2019, Knoxville, TN.
Perry, G. A., E. L. Larimore, G. G. Bridges, R. A. Cushman. 2012. Management strategies for improving lifetime reproductive success in beef heifers. Proceedings, Applied Reproductive Strategies in Beef Cattle, December 3-4, Sioux Falls, South Dakota.
Senturklu, S, D. G. Landblom, R. Maddock, T. Petry, C. J. Wachenheim, and S. I. Paisley. 2018. Effect of yearling steer sequence grazing of perennial and annual forages in an integrated crop and livestock system on grazing performance, delayed feedlot entry, finishing performance, carcass measurements, and systems economics. J. Anim. Sci., Vol. 96(6):2204-2218.
Senturklu, S., D. G. Landblom, and S. I. Paisley. 2019. Effect of cover crop bale feeding (grazing) after native range or annual forage on steer grazing and feedlot performance, carcass measurements and carcass value. North Dakota Beef Report #1938, pp 24-28.
| Table 1. Single TAI heifer development expense, income, and net return/heifer (Year 1). | |||
|---|---|---|---|
| DLOT - Control | IAF | NR | |
| No. Hfr/System | 32 | 32 | 32 |
| Expense | $865.18 | ####### | ####### |
| Income | |||
| Bred Hfr. (No./Amt) | 29/$1,336.58 | 14/$1,508.33 | 20/$1,577.99 |
| Open Hfr. (No./Amt) | 3/$1,206.96 | ||
| Finished Hfr. Carcass Value (No./Amt) | 18/$1,849.83 | 12/$1,799.93 | |
| Gross System Amt, $ | ####### | ####### | ####### |
| Gross System Amt/Hfr., $ | ####### | ####### | ####### |
| System Net Return/Hfr, $ | $459.25 | $221.15 | $327.54 |
| System Net Return vs. DLOT Control, $ | ($238.09) | ($131.71) | |
| Table 2. Single TAI heifer development expense, income, and net return/heifer (Year 2). | |||
|---|---|---|---|
| DLOT - Control | IAF | NR | |
| No. Hfr/System | 32 | 32 | 32 |
| Expense | $894.98 | ####### | ####### |
| Income | |||
| Bred Hfr. (No./Amt) | 32/$1,619.95 | 15/$1,641.02 | 11/$1,671.64 |
| Open Hfr. (No./Amt) | 0/$0.00 | ||
| Finished Hfr. Carcass Value (No./Amt) | 17/$2,319.82 | 21/$2,104.13 | |
| Gross System Amt, $ | ####### | ####### | ####### |
| Gross System Amt/Hfr., $ | ####### | ####### | ####### |
| System Net Return/Hfr, $ | $724.97 | $370.17 | $429.66 |
| System Net Return vs. DLOT Control, $ | ($354.80) | ($295.31) | |
Practical Use of Legume Crops in Diverse Crop Rotations
Douglas Landblom1, Songul Senturklu1,2, and Larry Cihacek3
1NDSU Dickinson Research Extension Center, Dickinson, North Dakota
2Canakkale Onsekiz Mart Universities, Canakkale, Turkey
3NDSU Dept of Natural Resource Sciences, Fargo, North Dakota
Introduction
Bacteria are ubiquitous living organisms found virtually everywhere in nature that can withstand extreme hot and cold temperatures. All plant life depends on a wide array of nutrients for growth and production; however, nitrogen is needed in large amounts and is made available to plants in multiple ways. Initially, soil organic matter (SOM) is decomposed through microbial activity resulting in inorganic ammonium nitrate and nitrate nitrogen, which are readily taken up by plants for growth. Leguminous plants, such as those shown in Table 1, for example, develop symbiotic bacterial relationships with plants and extract nitrogen (N2) from the atmosphere making inorganic nitrogen available directly to the plant. Specialized rhizobia bacteria that live in nodules formed on legume plant roots are instrumental for the supply of inorganic nitrogen to the plant. In return, the symbiotic leguminous plant relationship supplies the nitrogen-fixing bacteria with energy from plant sugars.
Table 1. Characteristics and uses of common legume crops grown in North Dakota
Carbon-Nitrogen Ratio |
Nutrients found in soil organic matter are not directly available for plant growth until nutrients become available in inorganic forms through a process identified as microbial nutrient cycling. Various organic substances subjected to microbial decomposition decompose at different rates with respect to the residue’s ratio of carbon to nitrogen. The C:N ratio of a few organic materials is shown in Table 2. Crop residues with low C:N ratios exposed to microbial nutrient cycling result in nitrogen availability for succeeding crops in a crop rotation. Crops that have high nutrient requirements such as corn and sunflower respond well to nitrogen from previous crops in a crop rotation that have low C:N ratios. Provided adequate soil moisture exists, microbial nutrient cycling supports soil nitrification that can replace a significant portion of the commercial nitrogen (urea) applied to crops. Cover crop mixes formulated at the Dickinson Research Extension Center (DREC) with a minimum of 60% leguminous crops in the mix have a C:N ratio of approximately 35%.
Table 2. Approximate Carbon: Nitrogen ratio of different organic substances.
|
Adapted from:
Midwest Cover Crops Field Guide, Third Edition, ID-433, midwestcovercrops.org
Cover Crop Chart, USDA-ARS Northern Great Plains Research Laboratory, www.mandan.ars.usda.gov
Magdoff, F. and H. Van Es. 2021. Building Soil for Better Crops, Fourth Edition, Sustainable Agriculture Research and Education (SARE), Handbook Series Book 10.
Crop Rotations, Legumes, and Biodiversity
Cropping systems differ from natural undisturbed native range systems that are stable and have evolved over thousands of years. Well managed crop rotations fit available soils, environmental conditions, and capitalize on crop complementarity. Successful farm managers evaluate a soil’s current condition and study cropping procedures and sequences that will improve soil health resulting in improved crop productivity, while reducing reliance on commercial fertilizers. The DREC has had a long-term integrated crop and livestock system in place from 2010-2023. For the investigation, spring wheat grown continuously on the same land has been compared to spring wheat grown in a five-crop rotation that included spring wheat, corn, and sunflower, and crop mixtures formulated with legumes (Dual: winter (triticale-hairy vetch)/summer (7-specie cover crop) and a field pea (60%)-forage barley (40%) mix). Due to the semi-arid region where the DREC is located, crops grown in the diverse rotation (Table 3) were placed in the rotation sequence based on legume nitrogen fixing characteristic, plant estimated water use, potential root residue volume, and each crop’s potential to form arbuscular mycorrhizal fungi root associations. Yearling steers grazed the field pea-forage barley mix, forage corn, and the cover crop. Collectively, the rotation includes the five principles of soil health: 1) Soil armor, 2) Minimized soil disturbance, 3) Plant diversity, 4) Maintaining a live plant or root in soil, and 5) Livestock integration. Although livestock grazing was a significant component of this research, non-livestock farms or livestock farms without the necessary infrastructure for grazing substitute with high value legume crops such as soybean, dry edible bean, lentil, or chickpea in the rotation as alternatives to the field pea-forage barley mix grown for grazing.
Table 3 Five-Crop Rotation (Three Field Replicates/Treatment).
|
What has been learned from the research?
Over the 10-year period, which is considered to be “long-term” due to the span of 10 years, soils in control and rotation spring wheat, and the rotation crops were sampled routinely. The presence of leguminous crops in the crop rotation coupled with livestock grazing had a long-term impact on soil nitrate nitrogen (NO3-N) change over time. Figure 1 shows trendline slopes for the control spring wheat and spring wheat grown in the 5-crop rotation. Cihacek, et al. (2022) documented a -3.3 pounds of N/year for the control spring wheat compared to 0.7 pounds N/year for the rotation spring wheat.
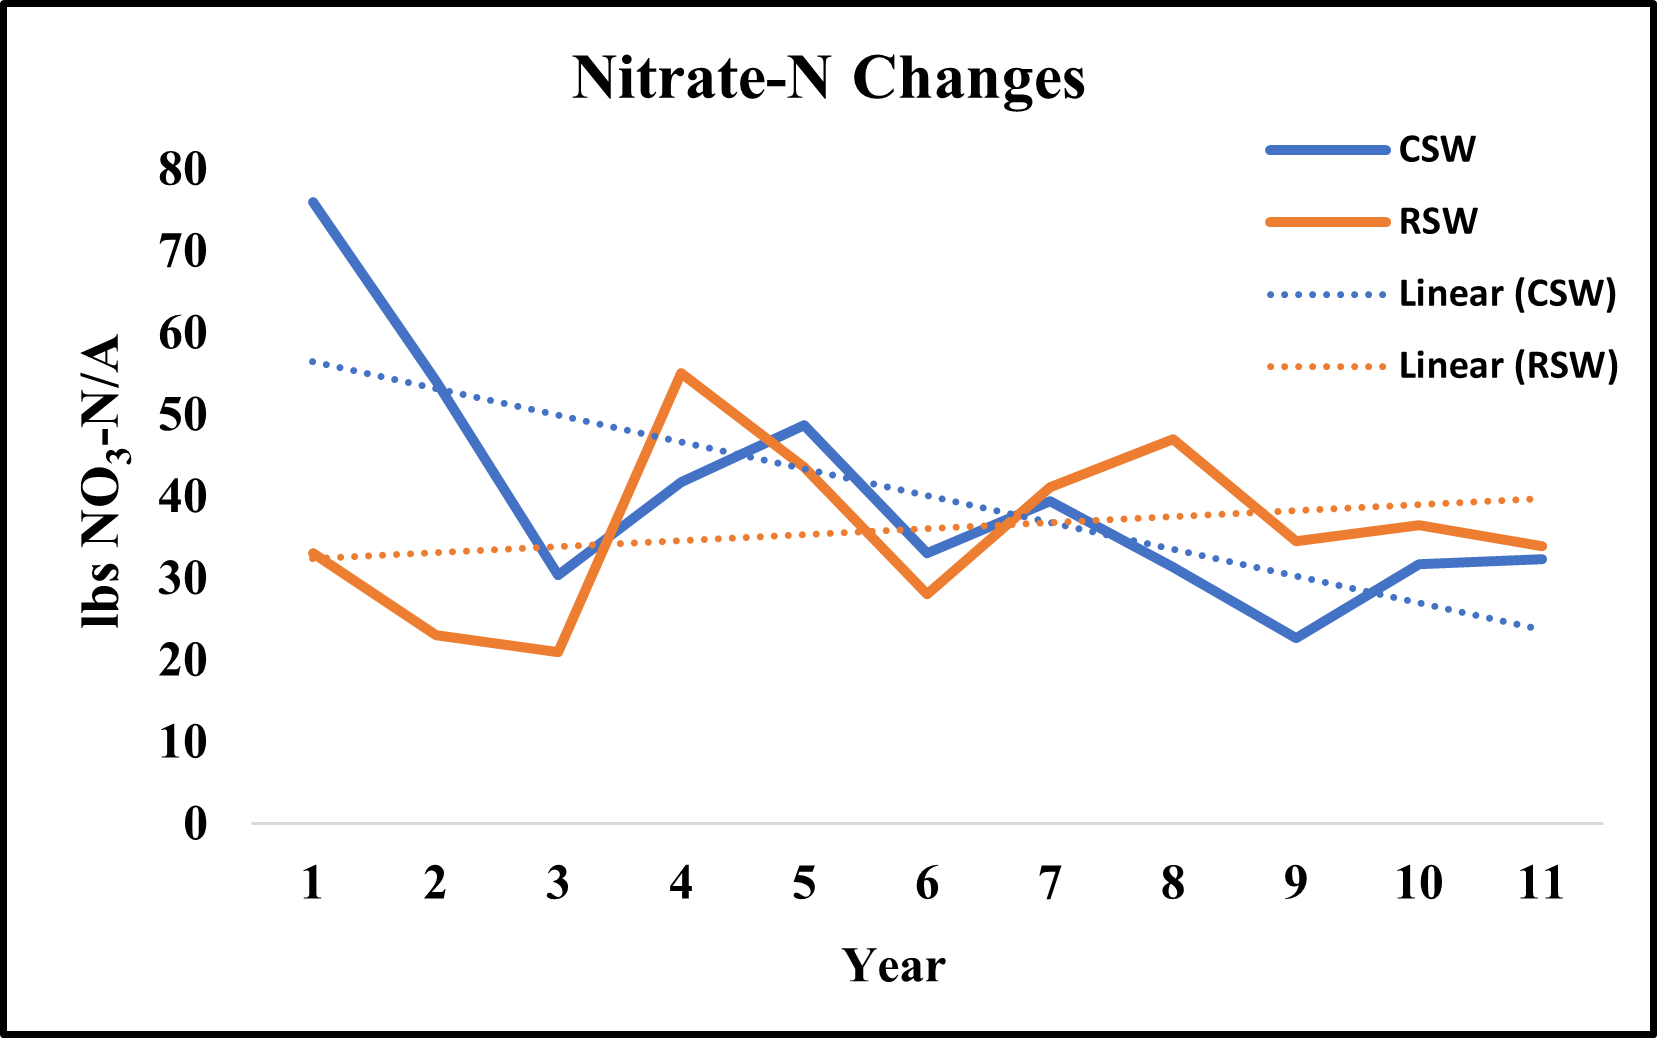
Figure 1. Ten-year change in soil nitrate nitrogen (NO3-N) (Cihacek et al. 2022).
A second primary principle gleaned from the soil health research is the relationship between soil organic matter and potential microbial nitrogen mineralization. Nitrogen mineralization dynamics clearly show the importance for cropping systems that increase soil organic matter year over year, because without continued cropping system emphasis on SOM the percent available to feed the soil microbial population will decline. Declining SOM translates in to declining potential for mineralized ammonium nitrate and nitrate nitrogen. Data from Dr. Cihacek’s laboratory has identified that there is a potential for 16.8 pounds of mineralizable N/acre for each 1.0% increase in soil organic matter. With this information, the farm manager must actively rotate crops in a manner that will maintain a constant supply of organic matter to the soil.
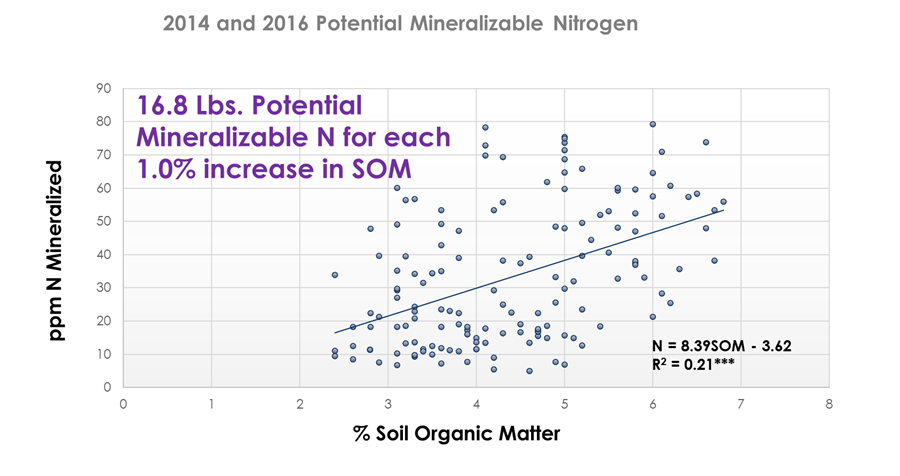
Figure 2. Potential microbial mineralizable nitrogen for each 1.0% increase in SOM (Cihacek et al.)
Abstract
Soil Health Using Haney Biological Analysis in Calcareous Soils in Semi-Arid Environments
Rashad Alghamdi1, Songul Senturklu2,3, Douglas Landblom2, and Larry Cihacek1
1Soil Science Department, North Dakota State University, Fargo, North Dakota 58108
2North Dakota State University, Dickinson Research Extension Center, Dickinson, North Dakota 58601
3Canakkale Onsekiz Mart Universities, Canakkale, Turkey 17200
Holistic agricultural management system approaches in semi-arid regions have been increasing widely. The effect of crop rotation, cover crop incorporation, and beef cattle integration under no-till systems has been at the forefront of regenerative farming processes to investigate the effect of the environment (precipitation and temperature) and the holistic farming operations. A 10-year study from 2011 to 2021 was conducted using the Haney biological analysis test. Hard Red Spring Wheat (HRSW-C) was grown continuously and compared to Hard Red Spring Wheat (HRSW-R) grown in a five-crop rotation dual cover crop (fall seeded winter triticale-hairy vetch and spring seeded multi-specie cover crop), silage corn, field pea-forage barley mix, and sunflower. The 1.74 ha fields were triple replicated. Beef cattle were integrated into the system to evaluate the potential economic benefits and biological effects on the soil. Soil samples were collected annually at the 0-8cm soil depth from 18 sample plots at the same time every year following harvest. Upon collection, samples were immediately placed into plastic bags and stored in a cooler with ice and sent to the lab for analysis. Lab analysis was conducted for soil pH, soluble salt, soil organic matter, NO3-N, NH4-N, inorganic N, total phosphorus, inorganic phosphorus, organic phosphorus, potassium (K), calcium (Ca), aluminum (Al), iron (Fe), sulfur (S), zinc (Zn), manganese (Mn), copper (Cu), magnesium (Mg), sodium (Na), and percent microbial active carbon. The results of this study may help inform producers in the region, and those in semi-arid environments, to consider adoption of such a system. The HRSW-C had significantly less N, P, Ca, CO2-Carbohydrate, Haney Test N, Mg, salts, and sulfur. The HRSW-R had significantly greater soil pH (pH = 6.3) compared to the HRSW-C (pH = 5.7); however, corn pH (6.4) in the rotation did not differ. Compared to the HRSW-C, N, Ca, OM, and Mg were significantly greater in the HRSW-R.
Alghamdi, R., Senturklu, S., Landblom, D., Cihacek, L. J. (2023) Soil Health Using Haney Biological Analysis in Calcareous Soils in Semi-Arid Environments [Abstract]. ASA, CSSA, SSSA International Annual Meeting, St. Louis, MO. https://scisoc.confex.com/scisoc/2023am/meetingapp.cgi/Paper/153051 (Poster)
Beef Cattle Producer Synchronized Fixed-Time AI Survey
1Douglas Landblom, 2Lauren Hanna, 3Bryon Parman, 4George Perry,
5Steve Paisley, and 1,6Songul Senturklu
1North Dakota State University, Dickinson Research Extension Center
2North Dakota State University, Animal Science Department
3North Dakota State University, Department of Agribusiness and Applied Economics
4Texas A & M University, Agrilife Research, Overton
5University of Wyoming, Sustainable Agricultural Research Extension Center
6Canakkale Onsekiz Mart University, Canakkale, Turkey
Research Brief:
Reproduction is unquestionably the single most important criterion in the beef cattle enterprise, because profitability begins with new birth, which is the initiator of new wealth. It is from the American ranchers who devote their resources and every ounce of energy into producing new wealth that accompanies each newborn calf.
Replacement heifers are literally the backbone of any beef cattle operation’s future performance, efficiency, and profitability. Therefore, selecting and breeding heifers to elite sires with known performance and efficiency traits is of utmost importance to the business enterprise sustainability. Because reproduction is the most profitable single management tool, heifers that calve early at the start of the calving season produce more pounds of beef and demonstrate greater herd longevity and lifetime productivity compared to their later calving counterparts.
For small to medium sized farm managers, access to elite sires is for the most part out of their reach financially; however, accessing the merits of elite sires artificially with known genomic enhanced genetic potential is the most rapid and efficient method to enhance genetic merit of replacement heifer offspring.
Artificial insemination is labor intensive, which is why <10% of breeding age females in the U.S. beef cattle herd are bred artificially? Nonetheless, cattlemen who know the value of the enhanced genomic merit available through AI devote the labor, expense, and focused time required to breed heifers artificially by appointment. Moreover, when TAI pregnancy rates approaching 60.0% or greater are attained, breeding cost per pregnant female is reasonably priced, because bull semen cost per unit has not increased appreciably over time compared to the average herd bull cost per pregnant female.
A voluntary survey of cattle ranchers that synchronize replacement heifers for AI was initiated with the 2021 breeding season for the purpose of establishing trends and identifying areas where future research efforts can be expended. Currently, three breeding seasons (2021, 2022, 2023) have been summarized in Table 1. Without question, environmental impact from drought, blizzards, long winter cold spells are stressors and, when combined with insufficient dietary energy levels, heifer response, and pregnancy rates are depressed. Drought during the 2021 breeding season and back-to-back April 2022 blizzards effected pregnancy rates. The 2022-2023 winter was very cold and combined with uncontrollable infestations of blood sucking horn flies and mucus feeding face flies heifers experienced elevated stress and pinkeye, which negatively affected 2023 pregnancy rates.
Looking at year-over-year change (Table 1) from 2021, 2022, and 2023 costs increased for feed and vaccine in drylot, but declined among the grazing herds during the 2023 breeding season. Semen cost increased in 2022 compared to 2021; however, semen cost in 2023 declined.
For the 2024 synchronized heifer breeding season, drylot producers are advised to increase TMR diet energy content. Producers developing heifers using pasture grazing systems are advised to increase energy-based pasture supplementation to ensure heifers are in a gaining condition beginning 30 days before the synchronized AI breeding and continuing for 30 days after synchronized breeding. In addition, if heifers are to be hauled to pastures after the AI breeding, season it must be done within five days after insemination or delayed until after 45 days. Hauling stress after five days, during the critical embryo uterine implantation process, results in an undesirable number of embryos being reabsorbed and the heifers come back into heat. Research has shown that vaccination of heifers with a modified live vaccine at the start of a fixed-time AI program can have a negative on heifer pregnancy (Perry et al., 2013). When using a modified live vaccine, a high percentage (38%) of estrous cycles were not normal. Serum hormone analysis revealed that estrogen concentration was significantly lower during the synchronization process and following the AI procedure progesterone levels were also reduced. Therefore, it is advised that vaccinations be completed at least 45 days before the start of the synchronized AI breeding season.
Controlling flies is an important management procedure for breeding heifers and cows. Horn flies suck blood and cause weight loss if not controlled and face flies are vectors for transmission of the pinkeye bacteria Moraxella bovis; therefore, fly control is an important management procedure as well as pre-breeding vaccinations for vibrio, pinkeye, and foot rot.
Voluntary rancher heifer synchronization survey results for 2024 will be added to the database and the 4-year breeding season results will be provided in this report next year.
Literature Cited:
Perry, G. A., A. D. Zimmerman, R. F. Daley, R. E. Buterbaugh, J. Rhoades, D. Scholz, A. Harmon, C. Chase. 2013. The effects of vaccination on serum hormone concentrations and conception rates in synchronized naïve beef heifers. Theriogenology, Vol. 79 (1), 200-205.
| Table 1. Beef cattle rancher heifer synchronization survey results (2021, 2022, 2023). | ||||||
|---|---|---|---|---|---|---|
| DRYLOT | GRAZING | DRYLOT | GRAZING | DRYLOT | GRAZING | |
| 2021 | 2021 | 2022 | 2022 | 2023 | 2023 | |
| Number of Systems | 3-Drylot | 3-Grazing | 1-Drylot | 5-Grazing | 1-Drylot | 5-Grazing |
| TMR Diet | ||||||
| Lb/Hd/Day | 25.7 | - | 35 | - | 31.7 | - |
| Cost/Ton | $58.15 | - | $73.42 | - | 163.42 | - |
| Suppl/Lb/Hd/Day | 2.17 | - | 4 | - | 2 | - |
| Grazing | ||||||
| Tame Grass & Native Range | Yes | Yes | Yes | Yes | Yes | Yes |
| Cost/Ac | - | $16.67 | - | $14.20 | - | 17.4 |
| Cost/Day | - | $0.90 | 0.7 | $0.61 | 0.7 | 0.81 |
| Pasture Yield, T/Ac | - | 0.567 | - | 1.08 | - | 1.06 |
| Vaccine Cost (Range $1.91 - $11.56) | $8.29 | $5.88 | $19.75 | $17.53 | 22.5 | 14.6 |
| Synchronization | ||||||
| No. Synchronized | 133 | 52 | 194 | 62.2 | 165 | 87.4 |
| No. Inseminated Before TAI | 135 | 2 | 165 | 65 | 130 | 16.8 |
| TAI Pregnancy | 56.20% | 74% | 59.00% | 57.00% | 56.40% | 50.30% |
| Repeat Pregnancy | 47.20% | - | 13.00% | - | 78.90% | - |
| TAI + Repeat Preg | 75.50% | - | 72.00% | - | 65.50% | - |
| Bull Bred | 27.20% | 13.3 | 18.60% | 27.15% | 11.50% | 34.10% |
| Open | 9.23% | 12.7 | 10.00% | 12.83% | 4.80% | 12.20% |
| Semen Cost | ||||||
| Avg Semen Cost | $21.33 | $16.21 | $20.00 | $20.20 | $18.00 | $18.40 |
| Avg Vet Preg Check Cost | $4.83 | $3.67 | $6.00 | $5.05 | $6.00 | $4.75 |