North Dakota Clay Mineralogy Impacts Crop Potassium Nutrition and Tillage Systems
(SF1881, Reviewed Sept. 2023)Chemistry of clays in North Dakota vary between locations. Clay chemistry affects tillage choice, resistance of soil to compaction and potassium crop nutrient availability. This publication provides insight into reasons for clay differences and general location of clay type for a location.
H. Bu, Research Specialist, NDSU School of Natural Resource Sciences
Soils in North Dakota are almost all classified as “mineral” soils. Except for Slope and Bowman counties in southwestern North Dakota, the state was covered with glacial ice sheets for most of the past 100,000 years (Bluemle, 1991).
The most recent glaciation boundary approximates the Missouri River Coteau. Most glacial sediments west of the Missouri River have eroded away, exposing more ancient sediments up to 80 million years old. The glacial history of the state is important because the glaciers moved over Canadian Shield rocks, some of which are among the oldest rocks on Earth.
The glaciers brought to North Dakota potassium feldspars, micas and other minerals sourced from these rocks, along with shale-derived sediments associated with the underlying marine bedrock of southern Alberta and Saskatchewan, and in the Red River Valley, carbonate-rich sediment derived from limestone bedrock from Manitoba.
Soil minerals are classified as sand, silt and clay based on their particle size. The clay portion of soil is composed of the smallest particles, defined as anything that is less than 0.002 millimeter (mm) in size. The clay-sized particle fraction includes materials that are small organic compounds, compounds without crystalline structure called “amorphous,” and compounds with crystalline structure properly classified as clay minerals.
The crystalline compounds that contain potassium and affect potassium crop nutrition fall into two categories: potassium feldspars, and micas and the minerals that are derived from them.
Potassium-containing Minerals in North Dakota Soils
Determining which minerals are most abundant is impossible by just looking at different soils in North Dakota. However, different minerals have different chemical properties that affect potassium behavior in soil.
The main clay-sized minerals in North Dakota soils are smectite, illite and kaolinite. Chlorite is found in a small number of soils. These minerals can form from the weathering of feldspar and mica minerals, or they may be inherited from parent material, or they can be “neo-formed” under certain chemical and physical conditions.
People often are familiar with mica because it is the shiny, flaky mineral in granite. Also found in granite, feldspar is the duller gray or pink mineral.
Mica can weather to form illite, smectite or kaolinite. The latter two minerals also can be formed from the weathering of feldspars. Illite is most like mica, and the two share many properties. Like mica, illite can weather to form smectite. Smectite and kaolinite also can be formed from the weathering of feldspars (Figure 1).
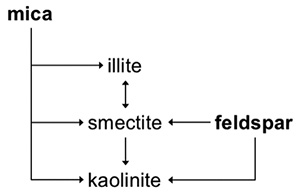
Once formed, smectite will, through time, weather to kaolinite, and that process is irreversible. Kaolinite is one of the end products of mica weathering and often is found in highly weathered soils.
Not all smectite will weather to form kaolinite. Under certain conditions, smectite will transform back to illite, and when conditions change, may change back to smectite again. The mechanisms for this dynamic nature of smectite and illite are discussed later.
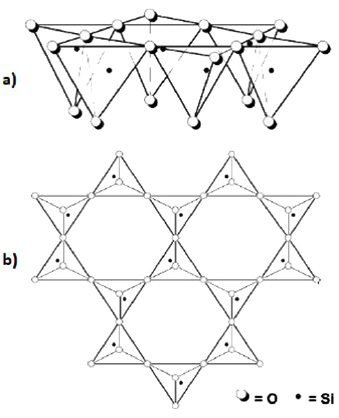
The building blocks of mica, illite, smectite and kaolinite are molecular sheets of silicon oxide (Figure 2) and sheets of aluminum hydroxide. Minerals are classified by the arrangement of these sheets.
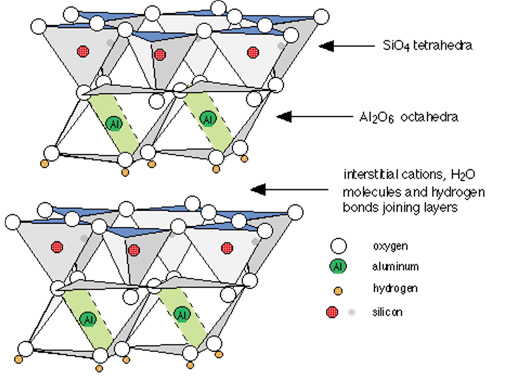
If one silicon oxide sheet adheres to one aluminum hydroxide sheet, the mineral is classified as 1:1. The prominent 1:1 mineral in North Dakota soils is kaolinite (Figure 3). If an aluminum hydroxide sheet is sandwiched between two silicon oxide sheets, it is 2:1. The most prominent 2:1 minerals in North Dakota soils are illite and smectite (Figure 4).
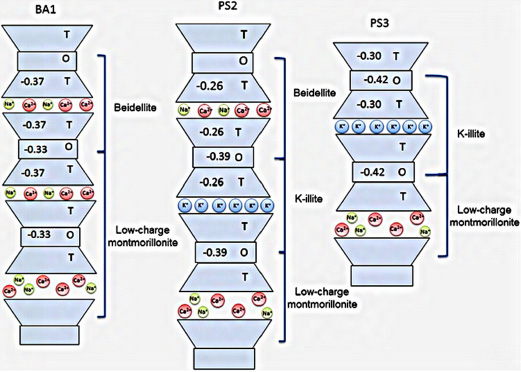
The 1:1 and 2:1 minerals have a net negative charge and, therefore, attract positive ions, called cations. In illite, the negatively charged 2:1 mineral sheets are held tightly together by potassium (K+) cations (Figure 4). In smectite, the 2:1 layers are farther apart than they are in illite and allow movement of K+ ions, as well as ammonium (NH4+), calcium (Ca2+), magnesium (Mg2+), sodium (Na+) and aluminum (Al3+) between the layers.
Water and acid (H+) also can move in and out between smectite layers. The cations between the 2:1 sheets are called “interlayer” cations. In smectite, these interlayer cations are surrounded by water, as opposed to the potassium in illite that has no water around it (Figure 5).
![Figure 5. Detailed schematic of montmorillonite, a smectite mineral. This image indicates the 3-D thickness of the 2:1 sheets (about 0.96 nanometer [nm]), the interlayer spacing range (from 0 to 4 nm), and the interior makeup of the 2:1 crystal (Al, Mg, Fe II or Fe III).](/agriculture/sites/default/files/2023-02/rgb-p03-figure-05-opt.jpeg)
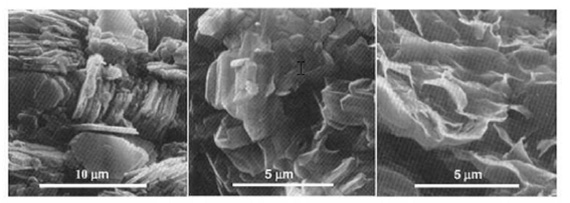
Clay minerals do not exist as individual sheets or pairs of sheets but as many sheets grouped together like the pages in a book and often are intermixed with other clay mineral types within a small space. Figure 6 shows electron micrographs of kaolinite, illite and smectite minerals.
Individual 1:1 layers bond together to form hexagonal-shaped plates in kaolinite. Smectite is a loose collection of nondescript, thin flakes. Illite looks more structured than smectite because it more closely resembles mica; however, the individual crystal sizes usually are smaller than mica and may not be as well-developed (Figure 6).
The negative charge of smectites and illites comes from imperfect conditions during their formation. The ideal chemical formula for a 2:1 mineral would produce no negative charge. However, different cations often substitute in the mineral structure. This process is called “isomorphic substitution.”
In the tetrahedral sheet, Al3+ sometimes substitutes for Si4+ because of their similar size. The Al3+ has one less positive charge than the Si4+. In the octahedral sheet, Fe2+ and/or Mg2+ similarly can substitute for Al3+. Fe2+ and Mg2+ have one less positive charge than Al3+.
In the mineral structure, whether in the tetrahedral or octahedral sheet, whenever a cation with less positive charge replaces a cation that had more positive charge, the negative charge of the mineral becomes greater. Substitution of lower positive charges for ions with greater positive charges is relatively common, giving the 2:1 clay minerals greater cation exchange capacity (CEC), compared with the 1:1 clay mineral kaolinite, which has far less isomorphic substitution and no interlayer spacing.
What is important to remember is that isomorphic substitution occurs within the mineral layers, changing the actual crystal structure of the mineral. This differs from cation exchange, where cations substitute for one another at exposed surfaces of minerals but not within the crystal structure.
Smectite in North Dakota has two variants: montmorillonite (Ross and Hendricks, 1945) and beidellite. Potassium is held more tightly in the interlayers of beidellite. This occurs because in beidellite, isomorphic substitution occurs primarily in the tetrahedral sheet, making that sheet negatively charged (Figure 4) (Baouabid et al., 1991; Bouna et al., 2012).
This sheet and its associated negative charge is physically closer to the K+ cation when it binds to the surface. This proximity of positive and negative charge holds K+ with a stronger bond.
In montmorillonite, isomorphic substitution occurs primarily in the octahedral sheet (Figure 5). That sheet is farther away from K+ because an uncharged tetrahedral sheet is between it and the K+ cation. The greater distance between the negative and positive charge holds K+ with a weaker bond.
Cation exchange capacity (CEC) is a measure of how many positive charges a negatively charged mineral can hold at its exposed surfaces and edges. Keeping with the book analogy, for illite, CEC measures how much positive charge can be held on each cover, as well as all four edges of the book when it is closed. However, for smectite, not only are these surfaces accounted for, but because the interlayer spaces are wider, the positive charges of each individual layer get added to the total. For smectites, usually more than 90 percent of the CEC comes from the interlayers (Bouabid et al., 1991).
Therefore, within the 2:1 clay minerals, smectite has much greater CEC than illite because smectite has greater interlayer spacing, allowing cations to move in and out of the interlayer spaces (Table 1). In addition, the wider interlayer spacing adds to the surface area of smectite because the surface area of each exposed layer is added to the total (see the column Internal in Table 1).
|
Mineral |
Surface area |
CEC |
||
|---|---|---|---|---|
|
Internal |
External |
Overall |
||
|
(square meters per gram) |
(meq(+) per gram) |
|||
|
Kaolinite |
0 |
15 |
15 |
1-10 |
|
Chlorite |
0 |
15 |
15 |
<10 |
|
Illite |
5 |
15 |
30 |
10-40 |
|
Smectite |
750 |
50 |
800 |
80-150 |
For illite, only the “covers” and the edges of the “closed book” are accessible. The slight amount of internal surface area listed for illite in Table 1 may reflect mineral layers that have frayed at the edges, exposing a small amount of the interlayer surfaces.
Mechanism for Illite to Smectite and Smectite to Illite Conversion
Another term for illite is “hydrous mica,” meaning that the clay chemistry closely resembles the original mica mineral with interlayer saturation of potassium ions (K+), but with greater interlayer spacing from K loss through time. The 2:1 mineral layers of illite and mica are held together by potassium ions (K+) that have no water around them. The interlayer space is too narrow for other cations or water.
When illite is in potassium-depleted soil, K+ begins to move out of the interlayers and into the surrounding soil, where it can be taken up and used by plants. Other cations that are surrounded by water start moving from the adjacent soil into the illite interlayers, beginning at the edges where the K+ first was lost.
This movement of hydrated cations into the interlayer pries open the edges of the minerals, like pages in a book, allowing for more K+ to move out and more hydrated cations to move in. Using the book analogy, this process is like slowly lifting a page of a book.
As interlayer K is lost, illite becomes more smectitelike because the interlayers are not as tightly bound and begin to expand. However, not all layers in illite may be affected, and even within a layer that has been affected, some K+ may be holding the mineral layers tightly together, resulting in only part of the layer being pried open. This is why the term “smectitelike” is used.
Part, but not all, of the illite has transformed to smectite, resulting in a mineral that is a mixture of the two, with smectite being more prevalent. Because the transformation is incomplete, it can be reversed, at least to some extent.
If soil becomes enriched with potassium through fertilization or recycling from crop residue, K+ begins to move back into the smectitelike layers, transforming them back to illite. So when potassium levels in soils drop, illite becomes more smectitelike, and when soils are enriched with potassium, smectite minerals become more illitelike.
In China, researchers examined the soil clay species in long-term alfalfa production (De-Cheng et al., 2001). Early in the study, surface clays were weakly illitic. As alfalfa hay was removed from the system, soil test K (CEC extractable K) was reduced. However, the surface soil illite became more strongly crystalline (enriched with K) as the alfalfa extracted deep soil K and deposited K at the soil surface, through leaves and other K-rich plant materials.
In Illinois, the Morrill Plots are a historic crop rotation and fertilization experiment on the University of Illinois campus dating back to 1876. After 124 years, continuous corn treatments with no added amendments had soils with smectitic clays, resulting from continual soil K removal and depletion of interlayer K from illite. However, in treatments where K was added as manure or K fertilizer, the soils were illitic (Velde and Peck, 2002).
Removal of K from illite ultimately results in smectite, while K addition to smectite eventually results in clay minerals with an illitic character. The change in clay type between smectite and illite also is evident as change in clay charge after conversion (Sato et al., 1992).
Potassium Availability in Soils
The traditional view of K availability in soils is:
Soil solution K ← Exchangeable K ← Non-exchangeable K ← Mineral K
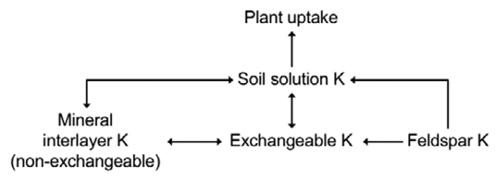
Soil solution K immediately available for plant uptake, exchangeable K readily in equilibrium with the soil solution in hours and days, non-exchangeable K contributing a small amount during the growing season and mineral K play little, if any role, in providing K to crops during the growing season. Non-exchangeable K is K trapped between the clay mineral interlayers.
In the traditional view, the only K available for plant uptake during the growing season is soil solution K and exchangeable K. Exchangeable K is measured by standard soil testing procedures. These same procedures are used to determine CEC.
Using the same book analogy when discussing CEC, exchangeable K for illite and smectite is the K bound on the two covers and along all four edges of a closed book. For illite, none or at least very little of the K between the pages of the book is exchangeable. It is bound tightly between individual, narrowly spaced 2:1 layers. This K is non-exchangeable.
However, for smectite, a significant portion of the K between the pages is exchangeable because the spaces between individual mineral layers are wider, allowing K to move from the interlayers to the soil solution, where it can be used by plants. The K in the soil solution is immediately available for plant uptake. Exchangeable K is in equilibrium with solution K.
As the plant takes up K and depletes the levels in the soil solution, exchangeable K moves from the exposed surfaces and edges of the minerals into the solution. Movement of exchangeable K into solution occurs in a matter of hours and days.
Finally, mineral K is the K that is part of the mineral structure of feldspars and micas. Mineral K traditionally has been viewed as very slowly available, contributing little to crops during their growing season.
More recent research into the speed of reactions has resulted in a quite different understanding of K equilibrium among soil solution, exchangeable, non-exchangeable and mineral K pools. The new view is that a portion of the non-exchangeable K is available to plants, and its release from the interlayers occurs in hours to days. This means that some of the K in illite interlayers is, in fact, available to plants, even though it is not accounted for in a standard soil test measuring only exchangeable K (Vetterlein et al., 2013).
In addition, mineral K in potassium feldspar (K-feldspar) and micas is released to the soil solution throughout the growing season (Hinsinger, 1993; Sparks et al., 1980). One study from Delaware in a low K-testing soil indicated that most crop K uptake came directly from K-feldspar, with another significant portion obtained from non-exchangeable K (Sadusky et al., 1987). Standard soil tests also do not measure plant-available K that is released from mica or feldspar minerals.
Potassium feldspars are metaphoric minerals found in granite. The K-feldspar crystals are “tubes” of silicon (Si+4) and aluminum (Al+3) oxides (Figure 8). In about 25 percent of the bonds, Al+3 substituted for the Si+4, producing a net negative (-) charge for K-feldspar.
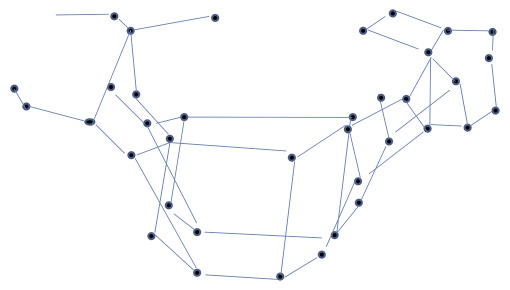
To balance the charge for the neutral-in-nature K-feldspar, K+ is held within the crystalline “tubes.” In soil, K+ ions are released from the K-feldspar in response to lower soil solution K+ concentration. The K-feldspar content of North Dakota soils is shown in Figure 9.
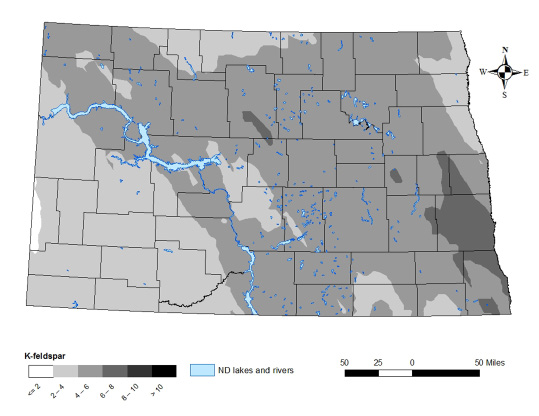
The potassium feldspar content of the soil mineral matter was as high as 15 percent in southeastern North Dakota, while soils in the Beach area contained values of 1 to 2 percent (Figure 9). The significant K-feldspar content of soils in the K-rate study area, previously described, probably was a factor in the modest corn yield increases to K.
In some parts of the U.S., the alleviation of K deficiency with K fertilizer might result in 50-bushel-per-acre yield increases; however, North Dakota sites had yield increases less than 30 bushels per acre, even with very low extractable K values.
Soil samples from the 0- to 6-inch depth were obtained for a K-rate study in corn from 2014 to 2016 in Cass, Richland, and eastern Sargent and eastern Barnes counties, totaling 30 sites. Corn response to K fertilization was best predicted when the relative amounts of smectite and illite in the clay fraction of soils were considered (Figures 10-12).
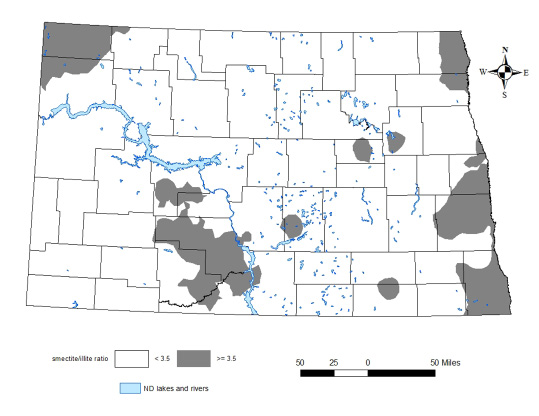
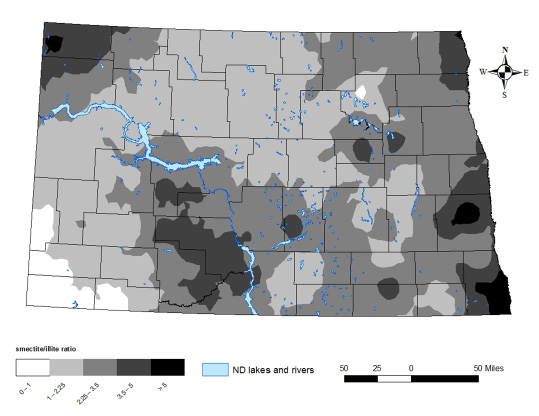
A smectite-to-illite ratio of 3.5 divided the experimental sites into two categories. When the smectite-to-illite ratio was greater than or equal to 3.5 (ratio =>3.5), the critical soil test level was 200 parts per million (ppm). Below this critical level, soil potassium was too low to meet the needs of corn, and yield increases were likely when potassium fertilizer was applied.
When the smectite-to-illite ratio was less than 3.5 (ratio < 3.5) the critical soil test K level was 150 ppm, 50 ppm lower than for ratio =>3.5. A map of North Dakota showing areas of higher and lower smectite-to-illite ratios is shown in Figure 10.
Causes of Different Critical Soil Test Potassium Levels
The term “K fixation” in clay interlayers does not imply that K+ is cemented for eternity within soil clays. In fact, K fixation is becoming an outdated term. A more appropriate term might be “temporarily retained.” Evidence presented earlier shows that K in interlayers can be available to plants during the growing season.
How much of it is available and when it is released depends on many factors. One of those is soil moisture.
Under dry conditions, more K is retained in the interlayers of smectites (Bouabid et al., 1991). When smectite soils dry, as they often do in North Dakota in July, the clay interlayer space tends to collapse, trapping K+ inside the interlayers and limiting their availability to the crop (Inoue, 1983). When moisture returns, K+ again is released into the soil solution.
For some soils in the recent North Dakota K-rate study with smectite/illite ratios > 3.5, corn plants would show K deficiency symptoms and respond to K fertilization even though soil test K values were greater than the old critical value of 150 ppm.
In corn, K deficiency symptoms first appear as yellowing on the margins of older, lower leaves. With advancing deficiency, leaf margins become brown and necrotic, and the next oldest leaves begin to show symptoms (Figure 14). When the soil received rainfall, the K deficiency symptoms did not worsen.
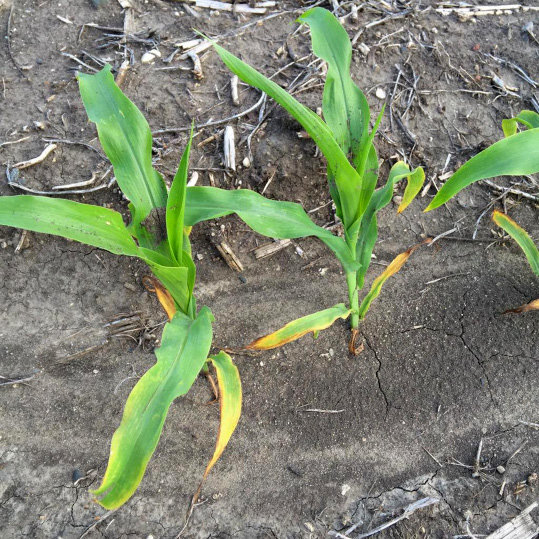
Yield increases of more than 20 bushels per acre were recorded at sites with a smectite/illite ratio > 3.5 when July/August soil conditions were relatively dry. Sites with a smectite/illite ratio < 3.5 were not affected by dry soil conditions with respect to K, and no response to K was recorded at some sites, even though the sites had soil test K in early spring much lower than the 150 ppm critical level.
Smectites in general, including montmorillonite, are susceptible to relatively small amounts of K retention in the mineral interlayers; however, the smectite mineral beidellite retains much more K in the interlayers because it holds K+ with stronger bonds and has a narrower interlayer space (Figure 4).
The Great Plains in general (Velde, 2001) contains smectites that include beidellite. North Dakota in particular, especially the Red River Valley (Badraoui et al., 1987), has high beidellite content within its suite of smectite clay minerals.
The severity of K fixation is greater with the presence of isomorphically substituted iron (Fe) in the aluminum octahedral sheet (Stucki, 1988; Khaled and Stucki, 1991; Florence et al., 2017). Under wet soil conditions, the reduction of Fe+3 to Fe+2 through reduction-oxidation (redox) reactions and, more importantly, through bacterial Fe reduction, decreases the clay interlayer space.
When Fe+3 is converted to Fe+2 in the mineral sheets, the reduced iron “plugs” the interlayer passages for K+ release from the interlayer space. When the Fe is oxidized again, the K+ can be released. North Dakota clays are rather high in Fe, and increased K fixation from Fe reduction probably is a contributing factor to high smectite soils requiring a greater soil test K critical value.
Another factor is the plant availability of interlayer K in illite. As discussed previously, K in the interlayers is not detected by standard soil tests, which measure only exchangeable K. Having this undetected pool of plant-available K in illite may be reducing the exchangeable K requirement.
Implications of Clay Mineralogy on Tillage Systems
Soil clays can impact the plant-rooting condition of the soil greatly, and soil structure, therefore, is dependent on the tillage and its interaction with clay (Page, 1955).
Smectites are expanding clay minerals with shrinking and swelling properties. Under wet conditions, and when frozen, the clay interlayer spaces expand. Under dry and thawed conditions, the interlayer spaces contract and collapse. These shrink-swell processes can break up compacted soil layers.
Illite has shrink-swell characteristics only at frayed mineral sheet edges, and the shrink-swell effect is small, compared with smectites. Kaolinite and chlorite have no shrink-swell properties. The total effect, in terms of resistance to farm machinery traffic and resulting compaction, therefore, can be affected by the mineral type in the soil.
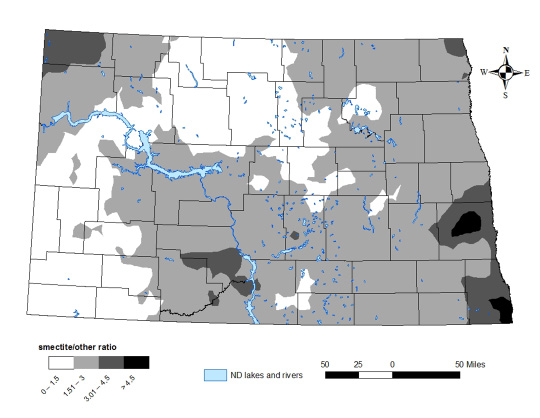
No soil that has been analyzed in North Dakota is 100 percent one mineralogy class in the clay fraction; instead, most soils contain a mixture of smectite, illite and kaolinite. Maps of the areas in North Dakota with different smectite-to-illite ratios and the ratio of smectite-to-“other” clay minerals can be found in Figures 11-12.
In the southeastern U.S., many soils are dominated by kaolinitic clays. Tillage studies in these soils support the use of deep tillage between crops to mitigate soil compaction. In regions that support two crops per year, fields are deep tilled between each crop for maximum return (Doty et al., 1975; Touchton et al., 1986).
In soils in the east-central Corn Belt, particularly Ohio, Indiana and Michigan, illitic soils are dominant; significant areas have a smectite clay influence. In Indiana, soil condition scores, on a scale of 0.0 as extremely poor and 1.0 as excellent, were 1.0 for perennial grass pasture, 0.87 for soils under a chisel-disc system and 0.80 for no-till. Macroaggregate scores were 1.0 for perennial grass pasture, 0.91 for chisel-disc and 0.88 for no-till (Hammac et al., 2016).
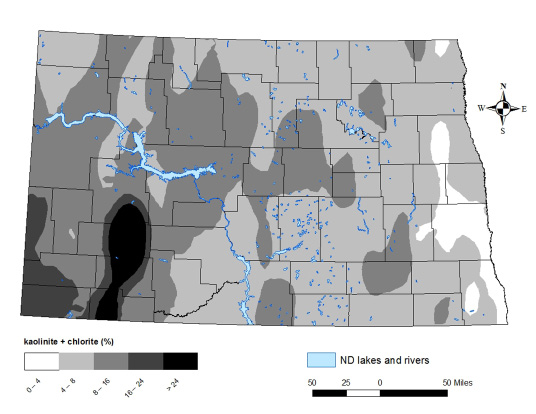
The conclusion of the study was that no-till might be practical for farmers, but they would need to take care to avoid soil compaction. Areas in western North Dakota are dominated by kaolinite clays and chlorite clays, which are similarly non-expanding, nonshrinking clay. A map of state kaolinite and chlorite clay content is in Figure 13.
In Ohio (Dick et al., 1986), a study comparing no-till with conventional-till systems concluded that use of no-till in corn production was positive on a Wooster soil (smectite and illite mixed clays) and neutral on a Crosby soil (smectite and illite mixed clays) but negative to production in a Hoytville soil (illitic clays).
High smectite-dominant soils are common in eastern North Dakota. The smectite/other map indicates that smectites are dominant across the state from the east to areas in southwestern and north-central North Dakota (Figure 12).
Giles (1994) conducted deep tillage experiments in the Red River Valley on Fargo and Glyndon soils for two seasons after deep tillage. The results indicated that deep tillage did not increase sugar beet yield or quality nor spring wheat yield at either site (Table 2). Pikul et al. (2001) had similar results in a nonsugar beet rotation in South Dakota in smectite-dominant soils.
|
Soil series |
Tillage treatment |
Sugar beet root yield |
Percent sucrose in sugar beet roots |
Net sucrose yield |
Spring wheat yield (1993) |
|---|---|---|---|---|---|
|
(tons per acre) |
(%) |
(lbs per acre) |
(bu per acre) |
||
|
Glyndon |
Check |
21.1 |
15.7 |
6,000 |
41 |
|
Paratill |
19.7 |
15.6 |
5,480 |
44 |
|
|
Straight shanks |
21.0 |
15.5 |
5,770 |
42 |
|
|
Significance 5% |
NS |
NS |
NS |
NS |
|
|
Fargo |
Check |
22.2 |
17.3 |
7,320 |
43 |
|
Paratill |
21.2 |
17.7 |
7,380 |
44 |
|
|
Straight shanks |
21.6 |
17.8 |
7,200 |
45 |
|
|
Significance 5% |
NS |
NS |
NS |
NS |
Observations From the Field
The resilience to compaction is greatest in high-smectite soils. A testament to the resilience of a highly smectitic soil is the rebound in production in the year after a wet sugar beet harvest in the Red River Valley.
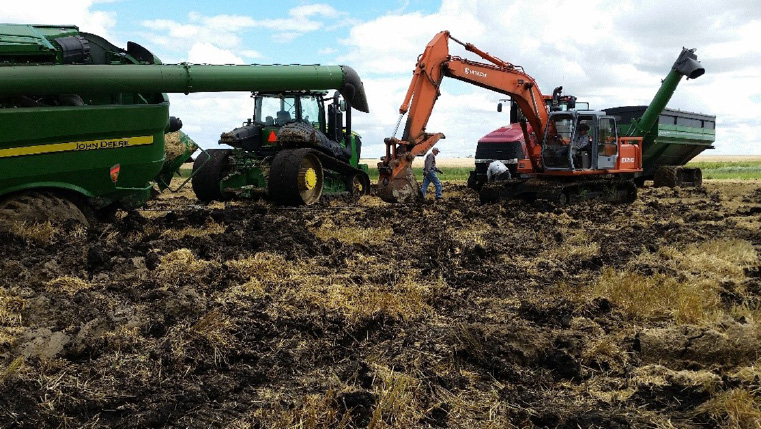
In wet harvest seasons from 1992 to 2015, harvest tractors often had to be pulled by a four-wheel drive tractor, and semi-tractor trailers loading sugar beets in the field had to be pulled with tractors pulling tractors. The tire ruts left in fields were 2 to 3 feet deep in many areas. Following tillage in late fall or early spring, followed by a spring rain, the soil was made mellow for planting the next crop.
I have experienced fields with high-smectitic soils subjected to a rock roller in the spring that made the soil surface so hard that the corn planter barely could make a seed furrow. Yet, after ½ inch rain just days later, one easily could scoop up a handful of mellow soil from anywhere in the field; the power of water moving into collapsed smectite clay interlayers resulted in an instantly productive soil.
I worked for 18 years at a retail fertilizer location about 20 miles north of Champaign, Ill. A clay mineral boundary was about 10 miles north of Champaign. South of the boundary were smectite-dominant soils (Flanagan and Drummer soil series), while north of the boundary, the clays were dominant illite soils (Elliott and Ashkum soil series) that occupied similar topography.
Farmers in the smectite-dominant soils could plant wetter, conduct tillage wetter and conduct field operations when the soil was on the wet side of being fit without negative effects. Farmers north of the boundary in illitic soils had to be more patient. They had to plant and till when the soils were truly fit.
Fields that were planted or tilled under wet conditions in the illite dominant region were impacted negatively by the operation through harvest, with compaction issues as a constant threat. From time to time, the soils had to be “cracked” or tilled periodically for greater productivity. Harvest ruts impact soil conditions in the subsequent year much more on illitic- and kaolinitic-dominant soils than smectitic-dominant soils (Figure 15).
What is remarkable, therefore, is that the southwestern area in North Dakota, where no-till has been used the longest with the greatest success, is the area in western North Dakota that is lowest in smectite content and with many fields with high kaolinite content (Figure 12; Figure 13). Perhaps the reason that no-till has been so successful was that early adopters were fortunate in their timing.
The 1970s until 1992 were relatively dry, with severe drought years from 1988 through 1990. By the time the most recent wet period began in 1992, soil aggregates and soil biology related to long-term no-till already were established.
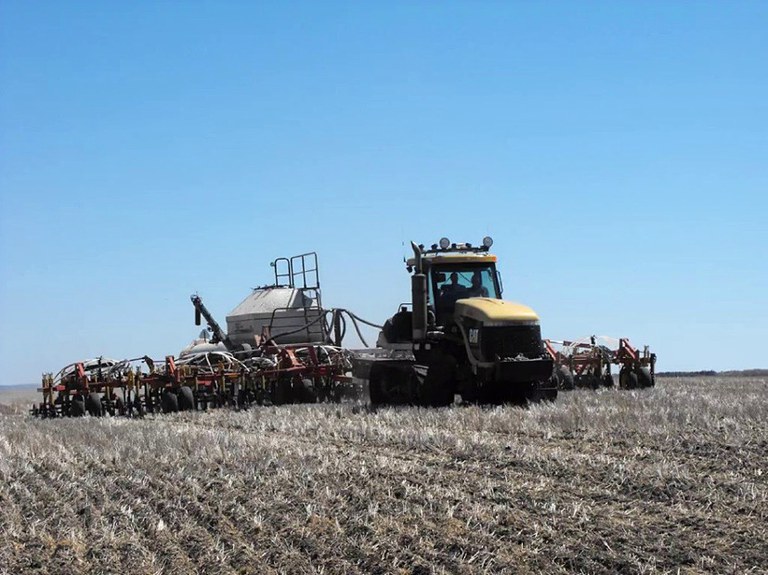
With the due care and patience common to North Dakota long-term no-till farmers, planting when it is fit, using controlled traffic in some systems and combining trips for fertilization at seeding to reduce traffic in the fields, these farmers have maintained and improved their soil health in the worst possible soil mineral types that might support it.
Western no-till farmer success provides encouragement to growers in eastern North Dakota who farm soils that are much more forgiving of early no-till establishment mistakes (Figure 12; Figure 16). With reasonable care and patience in crop establishment timing and field activities, no-till or modified no-till, such as strip-till systems, should be successful, especially with the increase in tile-drained fields and use of cover crops in eastern North Dakota fields.
Although conventional tillage is dominant to date in the Red River Valley and in soils with similar high clay content, a growing number of farmers are using no-till and strip-till in high-clay soils for periods as long as 40 years with excellent success. Utilization of cover crops in these systems appears to hasten conversion to no-till systems, with fewer adverse consequences of wet seasons and much higher traffic tolerance from heavy machinery.
Summary
Soil clay mineralogy in North Dakota is related to potassium nutrition of our crops and should be considered in tillage system choices. Soil clays are crystalline sheets with properties related to shrink-swell characteristics, the ability to capture and release crop nutrients of positive charge, and resistance or susceptibility to traffic compaction. Knowledge of the clay mineralogy within the state should help in the further development of crop production fertilization and tillage systems by farmers and their crop consultants.
Potassium recommendations for crops in North Dakota that consider clay mineralogy can be found in the following publications:
References
Allen, B.L., and B.F. Hajek. 1989. Mineral occurrence in soil environments. p. 199-278. In J.B. Dixon and S.B. Weed (eds.) Minerals in Soil Environments. 2nd ed. SSSA, Madison, Wis.
Badraoui, M., P.R. Bloom and R.H. Rust. 1987. Occurrence of high-charge beidellite in a Vertic Haplaquoll of Northwestern Minnesota. Soil Science Society of America Journal 51:813-818.
Bouabid, R., M. Badraoui and P.R. Bloom. 1991. Potassium fixation and charge characteristics of soil clays. Soil Science Society of America Journal 55:1493-1498.
Bouna, L., B. Rhouta, L. Daoudi, F. Maury, M. Amjoud, F. Senocq, M.C. Lafont, A. Jada and A. Aghzzaf. 2012. Mineralogical and physico-chemical characterizations of ferruginous beidellite-rich clay from Agadir Basin (Morocco). Clays and Clay Minerals 60:278-290.
De-Cheng, L., B. Velde, L. Feng-Min, Z. Gan-Lin, Z. Ming-Song and H. Lai-Ming. 2011. Impact of long-term alfalfa cropping on soil potassium content and clay minerals in a semi-arid loess soil in China. Pedosphere 21:522-531.
Dick, W.A., D.M. Van Doren Jr., G.B. Triplett Jr. and J.E. Henry. 1986. Influence of long-term tillage and rotation combinations on crop yields and selected soil parameters. I. Results obtained for a Mollic Ochraqualf soil. Ohio Agric. Exp. Sta. Res. Bull. 1180. Ohio State University, Wooster, Ohio.
Doty, C.W., R.B. Campbell and D.C. Reicosky. 1975. Crop response to chiseling and irrigation in soils with a compack A2 horizon. Transactions of the ASAE 18:668-672. American Society of Agricultural Engineers, St. Joseph, Mo.
Eslinger, E., and D. Pevear. 1988. Clay Minerals for Petroleum Geologists and Engineers. SEPM Short Course Notes No. 22. Society of Economic Paleontologists and Mineralogists, Tulsa, Okla.
Florence, A., M. Ransom and D. Mengel. 2017. Potassium fixation by oxidized and reduced forms of phyllosilicates. Soil Science Society of America Journal 81:1247-1255.
GeoSciences LibreText. 2014. The Earth’s Crust. MindTouch Inc. San Diego, Calif.
Giles, J.F., A.W. Cattanach and N.R. Cattanach. 1994. Effect of deep tillage on soil physical conditions and crop yield - 1993. Sugarbeet Research and Extension Reports 24:256-258. Available online (verified March 30, 2018).
Guimarães, V., E. Rodríguez-Castellón, M. Algarra, F. Rocha and I. Bobos. 2016. Kinetics of uranyl ions sorption on heterogeneous smectite structure at pH 4 and 6 using a continuous stirred flow-through reactor. Applied Clay Science 134:71-82.
Hammac, W.A., D.E. Stott, D.L. Karlen and C.A. Cambardella. 2016. Crop, tillage, and landscape effects on near-surface soil quality indices in Indiana. Soil Science Society of America Journal 80:1638-1652.
Hinsinger, P., and B. Jaillard. 1993. Root-induced release of interlayer potassium and vermiculitization of phlogopite as related to potassium depletion in the rhizosphere of ryegrass. Journal of Soil Science 44:525-534.
Inoue, A. 1983. Potassium fixation by clay minerals during hydrothermal treatment. Clays and clay minerals 31:81-91.
Karpiński, B., and M. Szkodo. 2015. Clay minerals - Mineralogy and phenomenon of clay swelling in oil and gas industry. Advances in Materials Science 15:37-55.
Khaled, E.M., and J.W. Stucki. 1991. Iron oxidation state effects on cation fixation in smectites. Soil Science Society of America Journal 55:550-554.
Page, J.B. 1955. Role of physical properties of clays in soil science. In Proceedings of the first National Conference on Clays and Clay Technology, 1952, Bulletin 169, Part IV: 167-176. Published 1955, State of California, Dept. of Nat. Res., Division of Mines, San Francisco, Calif.
Pikul, J.L. Jr., L. Carpenter-Boggs, M. Vigil, T.E. Schumacher, M.J. Lindstrom and W.E. Riedell. 2001. Crop yield and soil condition under ridge and chisel-plow tillage in the northern Corn Belt, USA. Soil & Tillage Research 60:21-33.
Ras, R.H.A., Y. Umemura, C.T. Johnston, A. Yamagishi and R.A. Schoonheydt. 2007. Ultrathin hybrid films of clay minerals. Physical Chemistry Chemical Physics 9:918-932.
Ross, C.S., and S.B. Hendricks. 1945. Minerals of the Montmorillonite Group, their origin and relation to soils and clays. U.S. Department of the Interior, Professional Paper 205-B, Washington, D.C.
Sadusky, M.C., D.L. Sparks, M.R. Noll and G.J. Hendricks. 1987. Kinetics and mechanisms of potassium release from sandy Middle Atlantic Coastal Plain soils. Soil Science Society of America Journal 51:1460-1465.
Sato, T., T. Murakami and T. Watanabe. 1996. Change in layer charge of smectites and smectite layers in illite/smectite during diagenetic alteration. Clays and Clay Minerals 44: 460-469.
Sparks, D.L., D.C. Martens and L.W. Zelazny. 1980. Plant uptake and leaching of applied and indigenous potassium in Dothan soils. Agronomy Journal 72:551-555.
Stucki, J.W. 1988. Chapter 8. Properties and behavior of iron in clay minerals. In Iron in Soils and Clay Minerals. Stucki, J.W., B.A. Goodman and U. Schwertmann eds. D. Reidel Publishing Co., Dordrecht, Holland.
Touchton, J.T., D.H. Rickerl, C.H. Burmester and D.W. Reeves. 1986. Starter fertilizer combinations and placement for conventional and no-tillage cotton. Journal of Fertilizer Issues 3:91-98.
Tovey, N.K. 1971. A selection of scanning electron micrographs of clays. University of Cambridge, Department of Engineering.
Velde, B. 2001. Clay minerals in the agricultural surface soils in the Central United States. Clay Minerals 36:277-294.
Velde, B., and T.R. Peck. 2002. Clay mineral changes in the Morrow Experimental Plots University of Illinois. Clays and Clay Minerals 50:364-370.
Vetterlein, D., T. Kühn, K. Kaiser and R. Jahn. 2013. Illite transformation and potassium release upon changes in composition of the rhizosphere soil solution. Plant Soil 371:267-279.
Wilson, M.J. 1999. The origin and formation of clay minerals in soils: past, present and future perspectives. Clay Minerals 34:7-25.

