Utilizing Band Ratios to Increase Contrast for Image Interpretation
Using band ratios to analyze remotely sensed data has become common in precision agriculture. The “Simple Ratio,” for instance, indicates the proportion of near-infrared radiation reflected from a leaf surface divided by the proportion of red radiation reflected from a surface. Every color image is created by “compositing” individual bands into a single image. A typical color image assigns Red to the red color gun (display), Green to the green color gun/display, and Blue to the blue color gun/display (Figure 1). However, we can manipulate the contrast in the image by assigning different bands or band ratios to different color guns/displays.

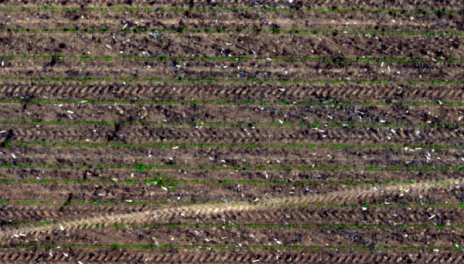
Higher color contrast will aid in identifying each corn plant separately from the surrounding weeds, useful for obtaining a stand count or identifying weeds. By calculating a simple RGB-based vegetation index known as Excess Green we can remove background effects and focus solely on the plants (Figure 2).

Taking this one step further, we can use the Excess Green index as an input band into our composite imagery. By approaching image interpretation in this manner, we exploit the way that electromagnetic energy interacts with the plant. Exaggerating the spectral differences better identifies the plants themselves (Figure 3).

The next logical step is to extract the information from the image. To do this we need to identify only those pixels that represent corn. There are a few approaches, but object-based image analysis (OBIA) involves segmenting the image based on not only spectral characteristics, but also on texture, shape, orientation, and size and then extracting that information. The result is a layer that represents only the plants, and that can be used to obtain stand counts (Figure 4).

There is much we can do with basic RGB imagery – from simply evaluating crop health, to obtaining accurate counts of plants.
David Kramar, PhD
David.Kramar@ndsu.edu
Extension Precision Agriculture Specialist