2023: Salt and Sodicity Tolerance of Barley, Oat and Sunflower
(Research Report, Langdon REC, December 2023)Barley and oats are some of the most salt and sodicity tolerant annual crops producers can profitably grow in North Dakota. At certain salinity and sodicity levels, even barley and oats can result in significant losses. Especially important are the levels of salinity and sodicity in the top six inches of the soils. To determine the economic threshold of soil salinity (Electrical Conductivity or EC) and sodicity (Sodium Adsorption Ratio or SAR) for barley and oats, four barley and four oat varieties were planted at the Langdon REC site in 2023 at three different levels of salinity and sodicity. This trial-demonstration was a repeat of 2020-2022. In addition, four sunflower varieties were added in 2023 to compare salinity and sodicity tolerances of sunflowers versus barley and oats.
Soil Analysis Results
Two-foot-deep composite soil samples separated into 0-6 and 6-24 inch depths were taken on May 15, 2023 by taking three cores for each sample. The three levels of salinity and sodicity were described as levels 1, 2 and 3 and were sampled separately. Level 1 was described as having low to moderate levels of salinity and sodicity, level 2 having moderate to high levels and level 3 having very high levels based on the 0-6 inch depth soil results. These descriptions were based on the salinity and sodicity tolerances of crops like barley and oats and not the sensitive crops such as soybean. Soil EC and SAR were analyzed by using the saturated paste extract method (Table 1).
Table 1. The 2020-2023 soil EC and SAR results of the three levels for the 0-6 and 6-24 inch depths.
|
|
| EC (dS/m) | SAR | ||||||
|---|---|---|---|---|---|---|---|---|---|---|
Site | Sample ID | Depth (inches) | 2020 | 2021 | 2022 | 2023 | 2020 | 2021 | 2022 | 2023 |
Level 1 | Low to moderate salinity-sodicity | 0-6 | 3.99 | 4.63 | 1.64 | 5.44 | 7.12 | 6.20 | 4.95 | 6.68 |
6-24 | 7.32 | 7.49 | 6.70 | 8.02 | 15.05 | 14.72 | 15.50 | 12.52 | ||
Level 2 | Moderate to high salinity-sodicity | 0-6 | 7.80 | 13.20 | 7.92 | 10.30 | 18.13 | 22.88 | 16.28 | 17.07 |
6-24 | 10.39 | 12.29 | 11.03 | 12.27 | 20.92 | 21.14 | 39.54 | 19.12 | ||
Level 3 | Very high salinity-sodicity | 0-6 | 10.50 | 14.90 | 11.21 | 11.99 | 27.30 | 32.74 | 30.00 | 22.06 |
6-24 | 9.86 | 12.98 | 11.10 | 11.44 | 32.87 | 32.04 | 31.83 | 22.32 | ||
The main difference between the three levels has been the low to moderate salinity and sodicity levels in the 0-6 inch depth of level 1, while, levels 2 and 3 had moderate to high and very high levels in the 0-6 and 6-24 inch depths. The 6-24 inch depth of level 1 had moderate to high salinity and sodicity levels. The lower salinity and sodicity levels in the 0-6 inch depth of level 1 and corresponding germination, stands, yields and quality in 2020-2023 indicate that the levels of salinity and sodicity in the surface layers are more important than the subsurface layers.
Annual snowfall, resulting spring-melt and rainfall in spring and early growing-season also had an impact on salinity and sodicity, especially in the 0-6 inch depths. Weather in 2020 was normal, 2021 was dry (spring and early growing-season), 2022 was wet (spring and early growing-season) and 2023 was again mostly dry. In the 0-6 inch soil depths, dry weather in 2021 resulted in a slight increase in EC in all levels versus 2020. Wet weather in 2022 resulted in slightly lower EC levels compared to 2021. Lower EC levels combined with high moisture availability in 2022 spring and early growing-season resulted in improved germination, stands and higher yields even at higher salinity and sodicity levels (levels 2 and 3) compared to 2020 and 2021. Dry weather in 2023 resulted in increased salinity and sodicity levels in the 0-6 inch soil depths of all levels.
Plot Sizes, Planting and Harvesting Details
Plot sizes were 4.7 X 22 feet. Planting and harvest details are in Table 2.
Table 2. 2023 crop, variety, planting date, seeding rate and depth, fertilizer rate and harvest date information.
Crop | Variety | Planting Date | Seeding Rates (live seeds/acre) | Seeding Depth (inches) | Fertilizer Application (lbs./acre) | Harvest Dates |
|---|---|---|---|---|---|---|
2023 Planting Details | ||||||
Barley | AAC Synergy (2-row) | May 30, 2023 | 1.0 million | 1 to 1.5 | Due to the delay in soil results a uniform rate of 40 pounds of P2O5 and 150 pounds of N per acre was hand broadcasted and rototilled in to all three levels before planting. | Level 1 barley and oats were straight combined on September 8, 2023. Levels 2 and 3 were combined on September 20, 2023. |
ND Genesis (2-row) | ||||||
ND Treasure (6-row) | 1.25 million | |||||
Tradition (6-row) | ||||||
Oat | CS Camden | 1.0 million | ||||
ND Heart | ||||||
Rockford | ||||||
ND Spilde | ||||||
Sunflower | Sunflower A | 20,000 plants per acre | All three levels were harvested on October 17, 2023. | |||
Sunflower B | ||||||
Sunflower C | ||||||
Sunflower D | ||||||
Results and Discussion
Similar to 2020, 2021 and 2022, there were differences between the three levels in seedbed, germination, plant growth and vigor, maturity, yield, and quality in 2023.
Differences in Seedbed
Similar to previous years the seedbed was rough and cloddy with an increase in soil sodicity (levels 2 and 3) compared to areas with low sodicity (level 1) in the surface layers (0-6 inch depths). This effect has been decreasing every year due to continuous tillage, but was still observed in 2023. See seedbed pictures 1-3 below for comparisons.
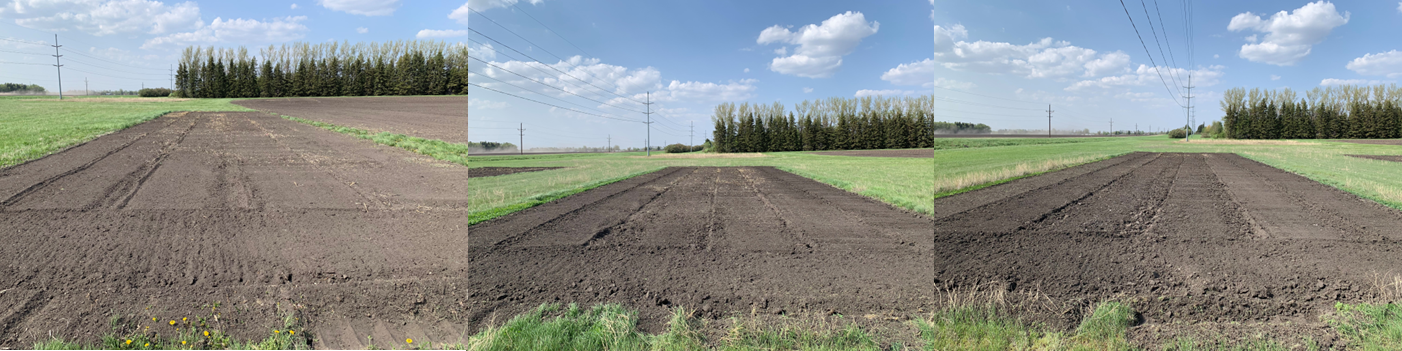
Pictures 1-3 from left to right: Differences in seedbed between level 1 (low to moderate salinity-sodicity), 2 (moderate to high salinity-sodicity) and 3 (very high salinity-sodicity) on May 25, 2023.
Differences in Germination
Due to the dry 2023-spring, germination was delayed in levels 2 and 3 versus level 1. Barley and oat seed started germinating 5-6 days after planting in level 1. In the seedling stage, oats always appeared slower in growth compared to barley irrespective of the year but would catch up during the growing-season. The sunflower seed took a day or two longer to germinate than barley and oat in levels 1 and 2. Germination in level 2 was 5-6 days delayed compared to level 1. In level 3, sunflowers started germinating 14 days after planting, and the barley and oats took around 20 days to germinate. Effects of increases in soil sodicity also resulted in soil crusting in levels 2 and 3 that affected the germination of barley and oat seed, while the bigger sized sunflower seed started germinating through cracks or pushed through the crusted soil layers. Smaller sized barley and oat seeds had a disadvantage compared to sunflower as the oat seedlings could not push through the crusted soil layers. See pictures 4-6 below.
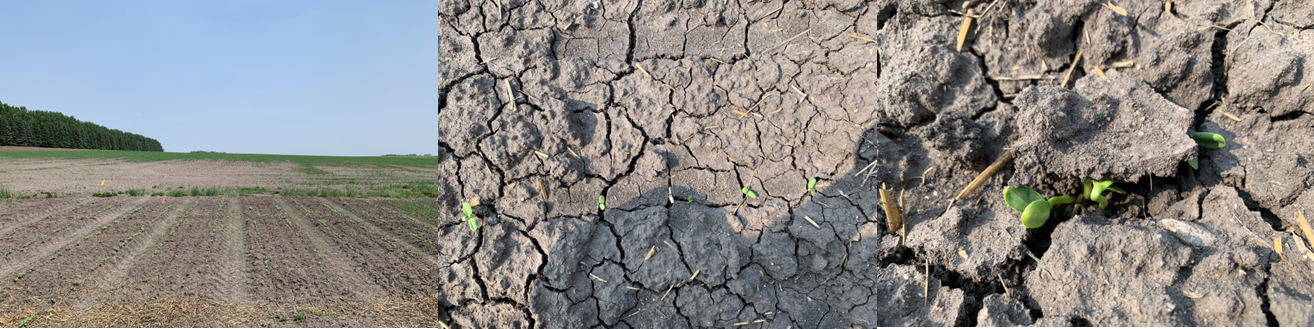
Pictures 4-6 from left to right: Sunflower seed germinating without any difficulty in level 1 (low to moderate salinity-sodicity), however, germinating only through soil cracks or by lifting crusted layers in level 2 (moderate to high salinity-sodicity) and level 3 (very high salinity-sodicity) on June 13, 2023.
Differences in Growth, Vigor, Stand and Maturity
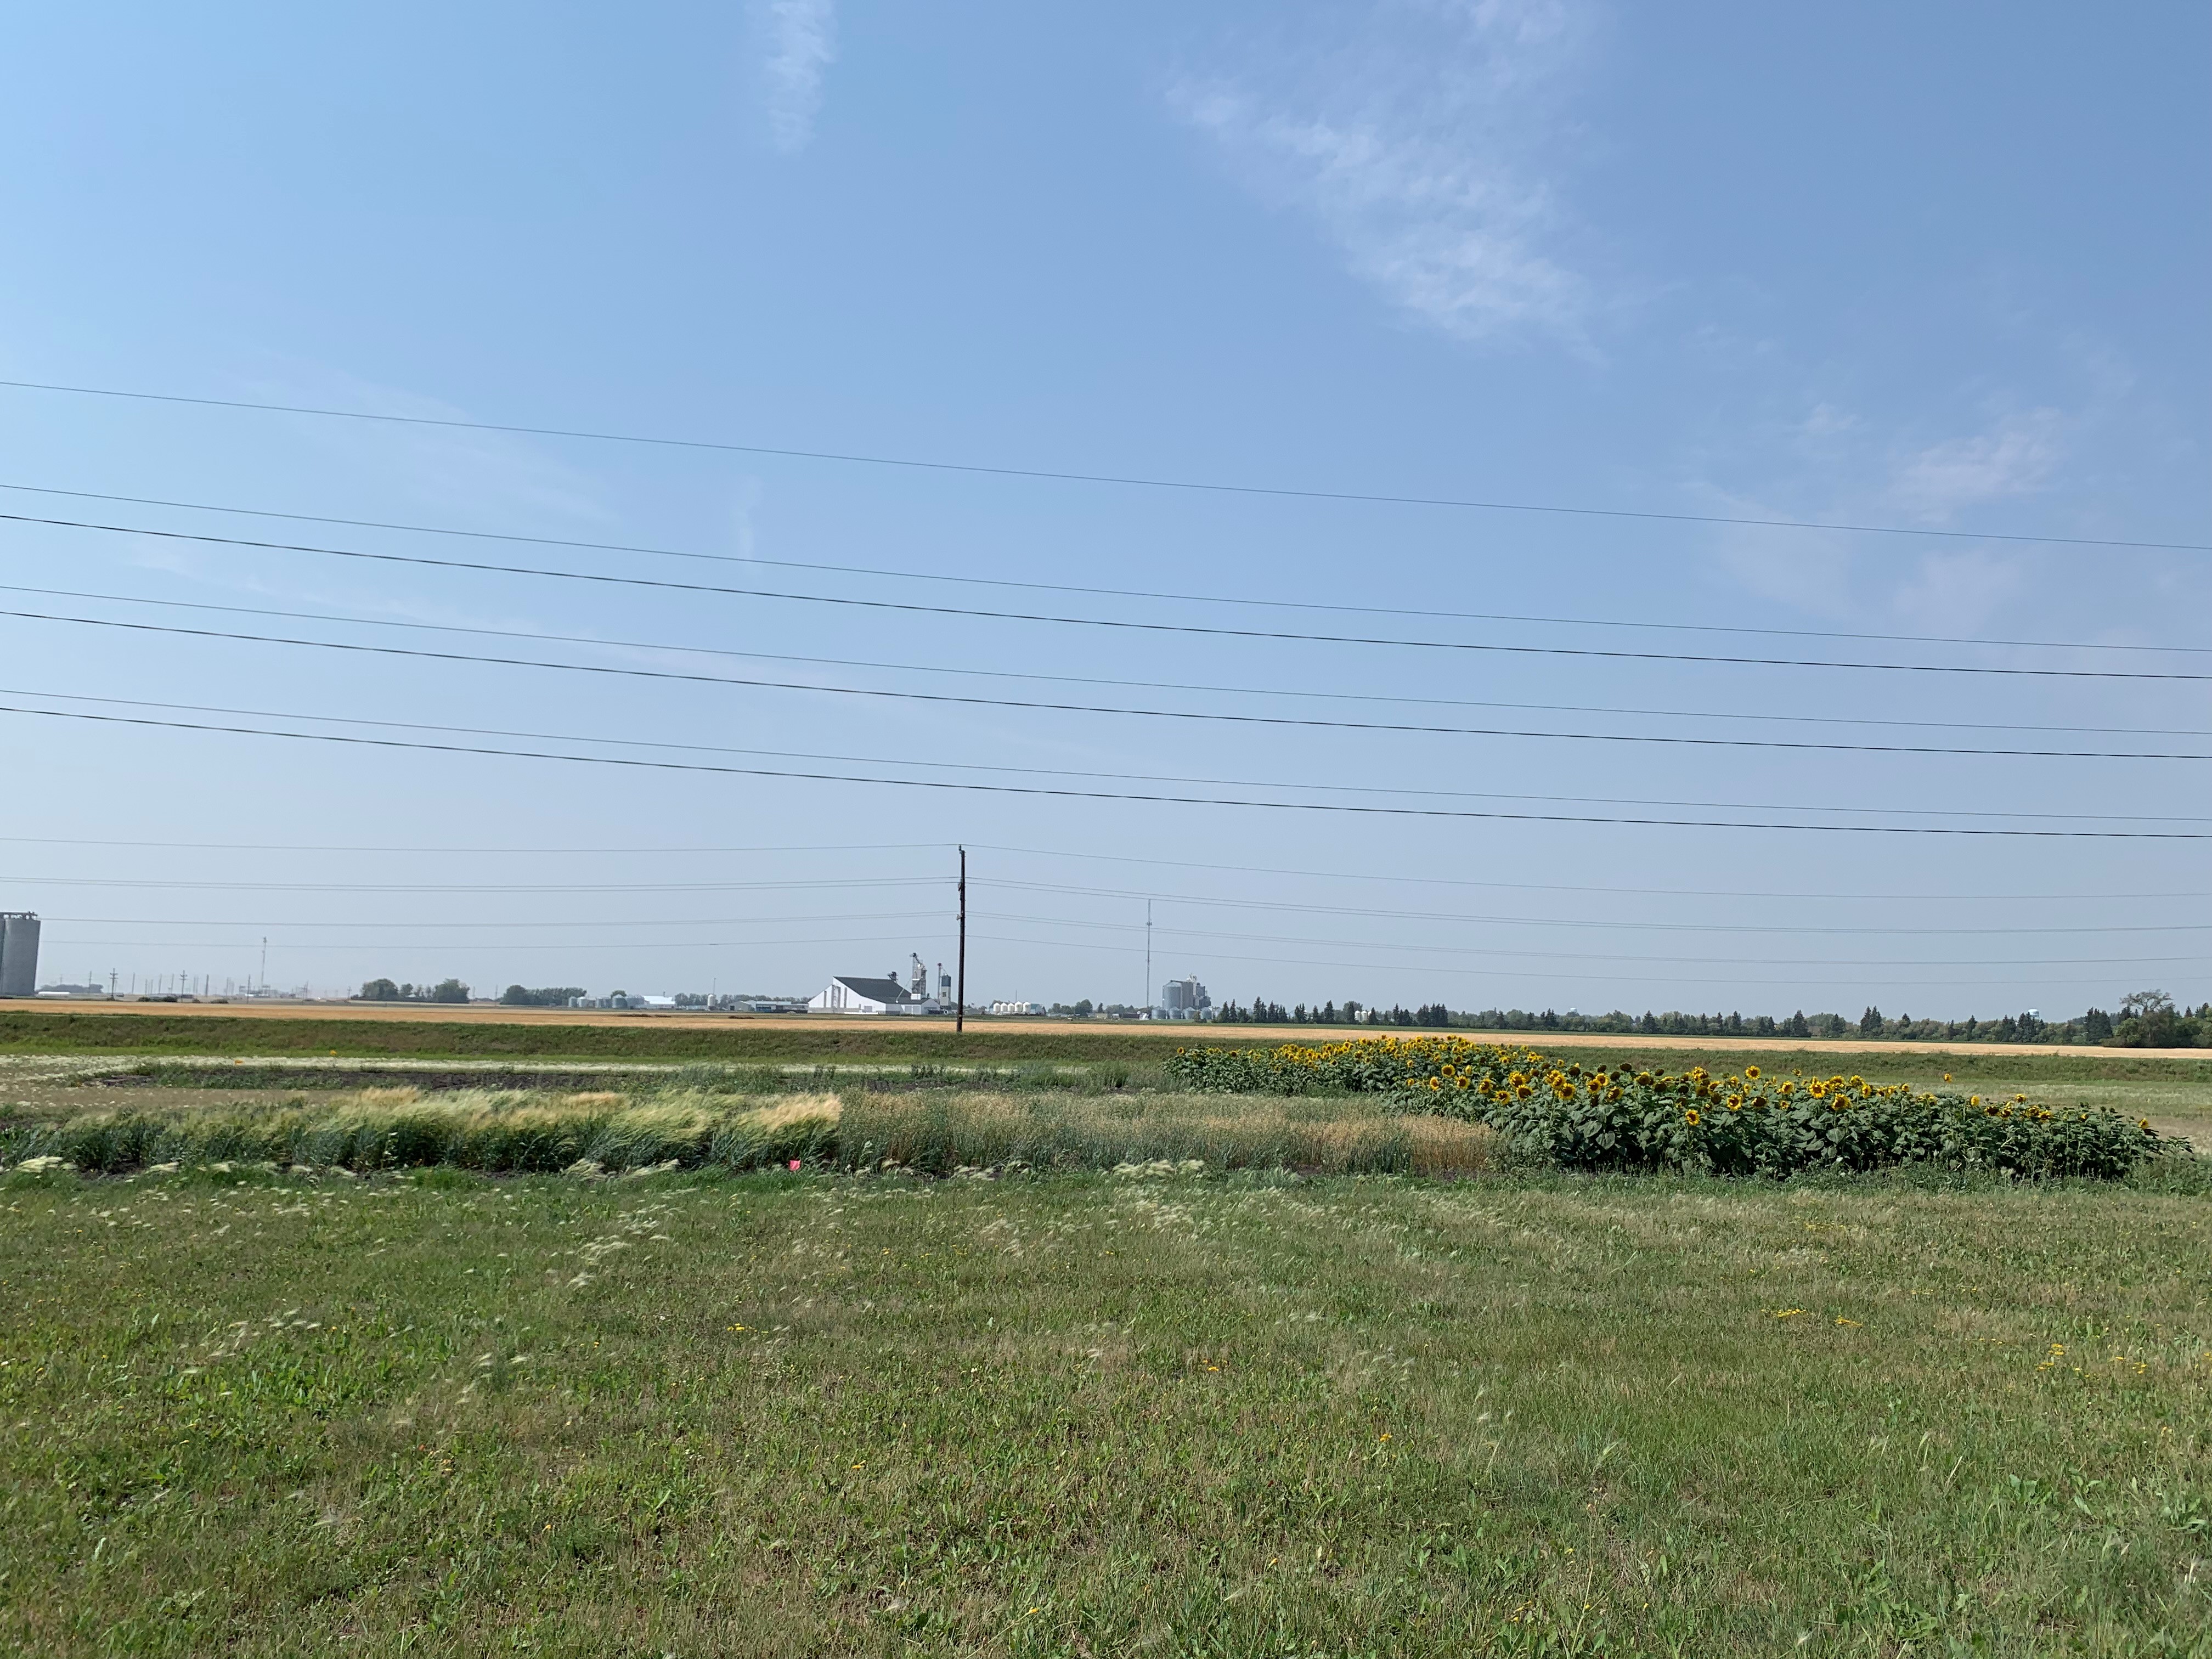
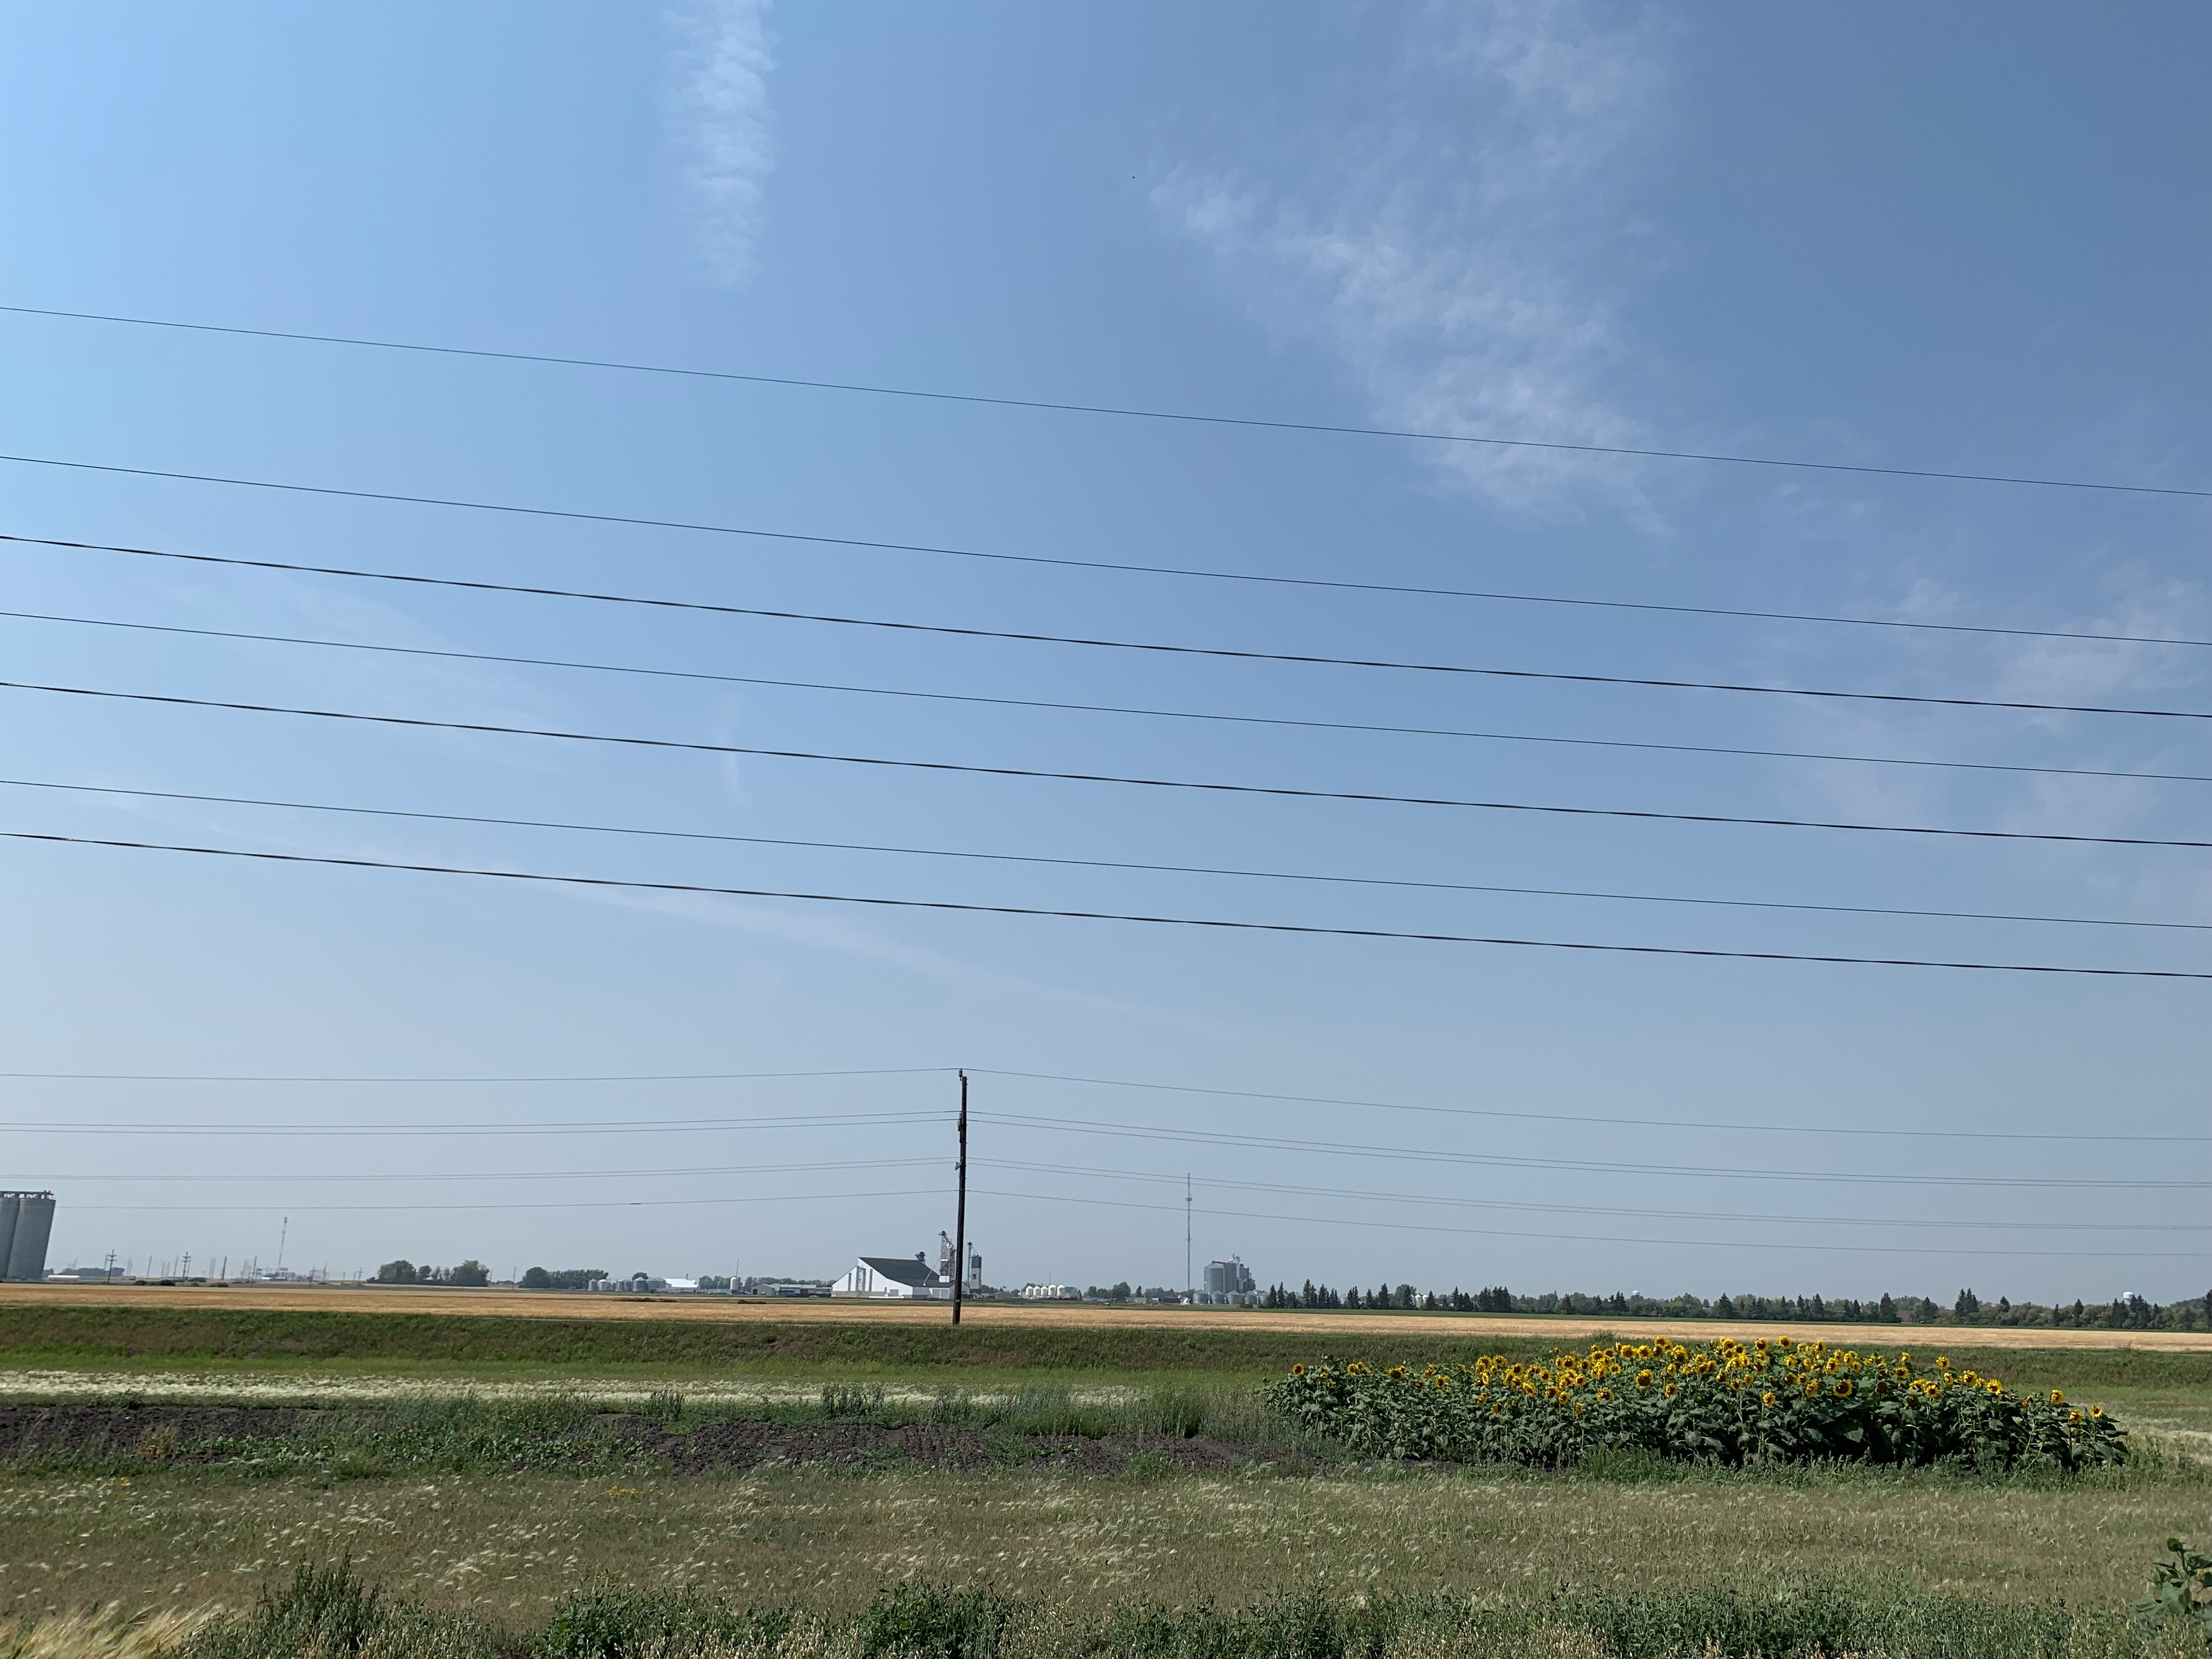
Barley and oat growth, vigor and stand looked much better in level 1 versus levels 2 and 3. In level 3, there were hardly any barley and oat plants but was not true for sunflowers. The growth, vigor and stands of sunflowers in all three levels looked almost identical. Both 2021 and 2023 growing-seasons were dry. In 2021-spring there was more moisture in the topsoil compared to 2023-spring when there was less moisture in the topsoil. Since barley and oat plants have shallow fibrous roots compared to longer tap roots of sunflowers, sunflower plants were able to extract moisture from the deeper soil depths. Weather patterns vary from year to year and in growing-seasons producing different results due to differences in moisture levels. See pictures 7-9 below.
Crop maturity was not uniform and was delayed with the increase in salinity and sodicity. When combined, level 1 was fully mature with no green plants, level 2 had some green plants and level 3 had many greens. Sunflowers matured at the same time in all three levels.
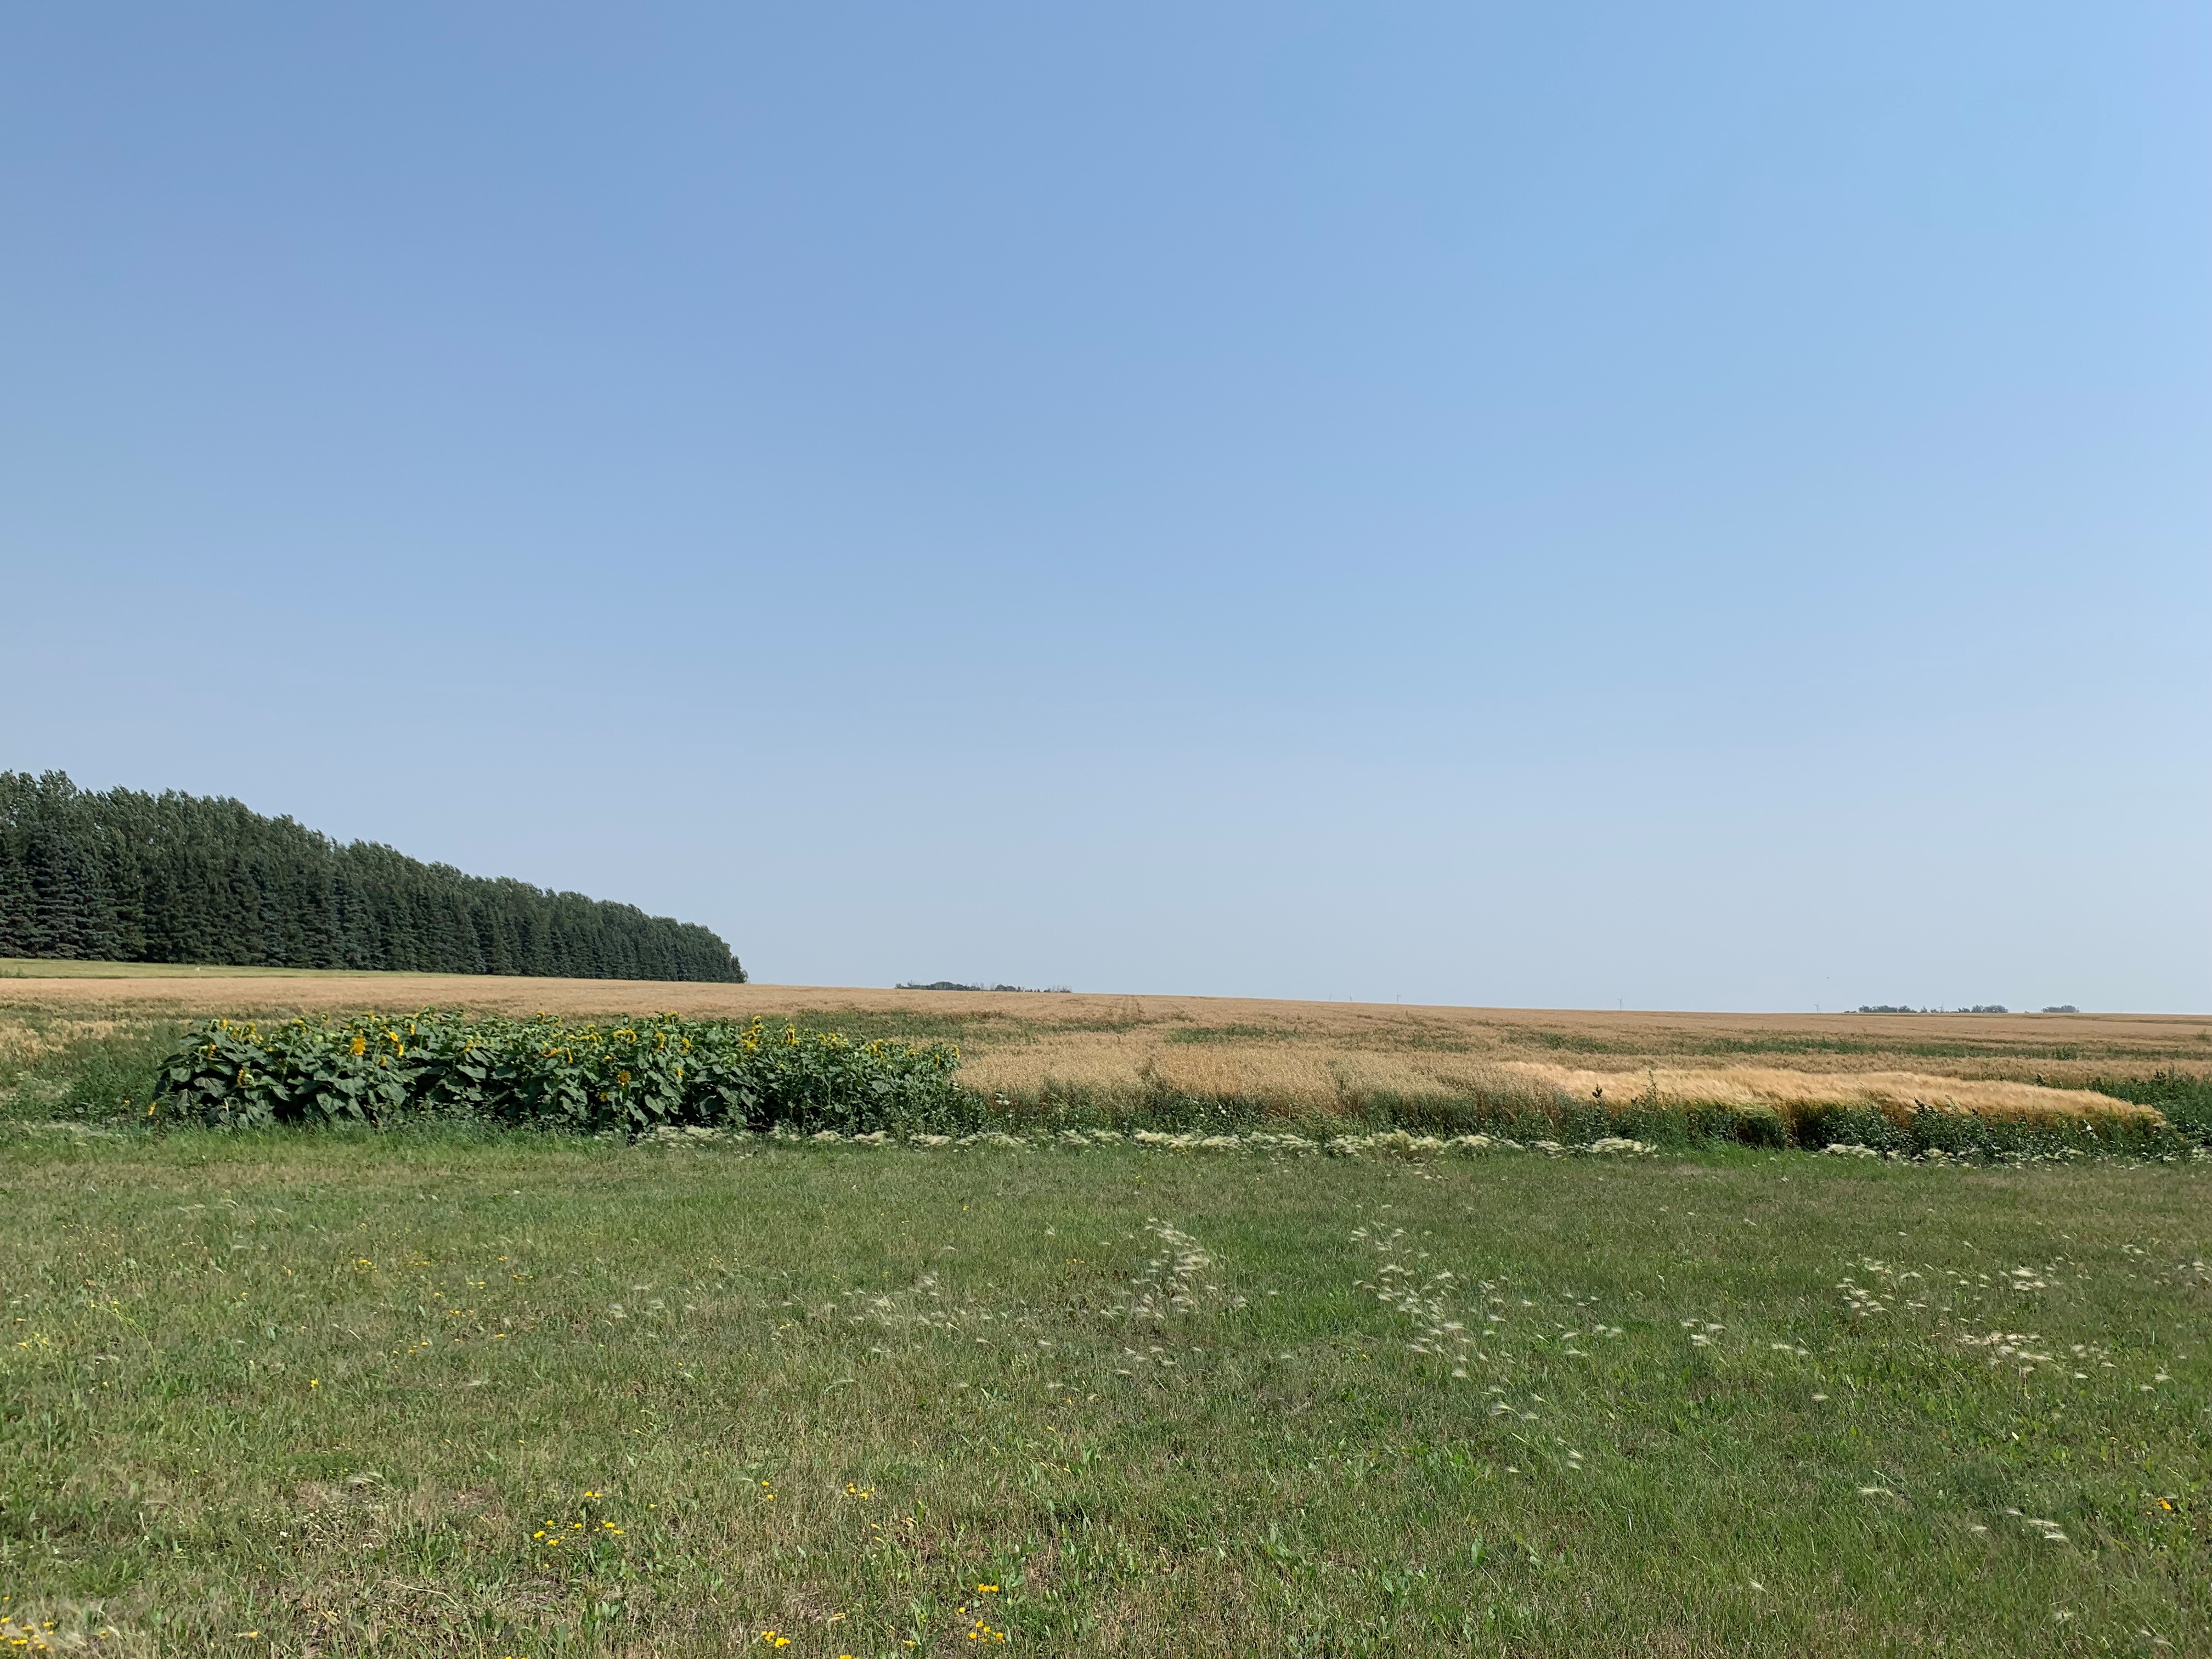
Picture 7. Sunflower (left), oat (middle) and barley (right) varieties growing in level 1 on August 18, 2023.
Picture 8. Barley (left), oat (middle) and sunflower (right) varieties growing in level 2 on August 18, 2023.
Picture 9. Barley (left), oat (middle) and sunflower (right) varieties growing in level 3 on August 18, 2023.
Differences in Yield and Quality
Barley
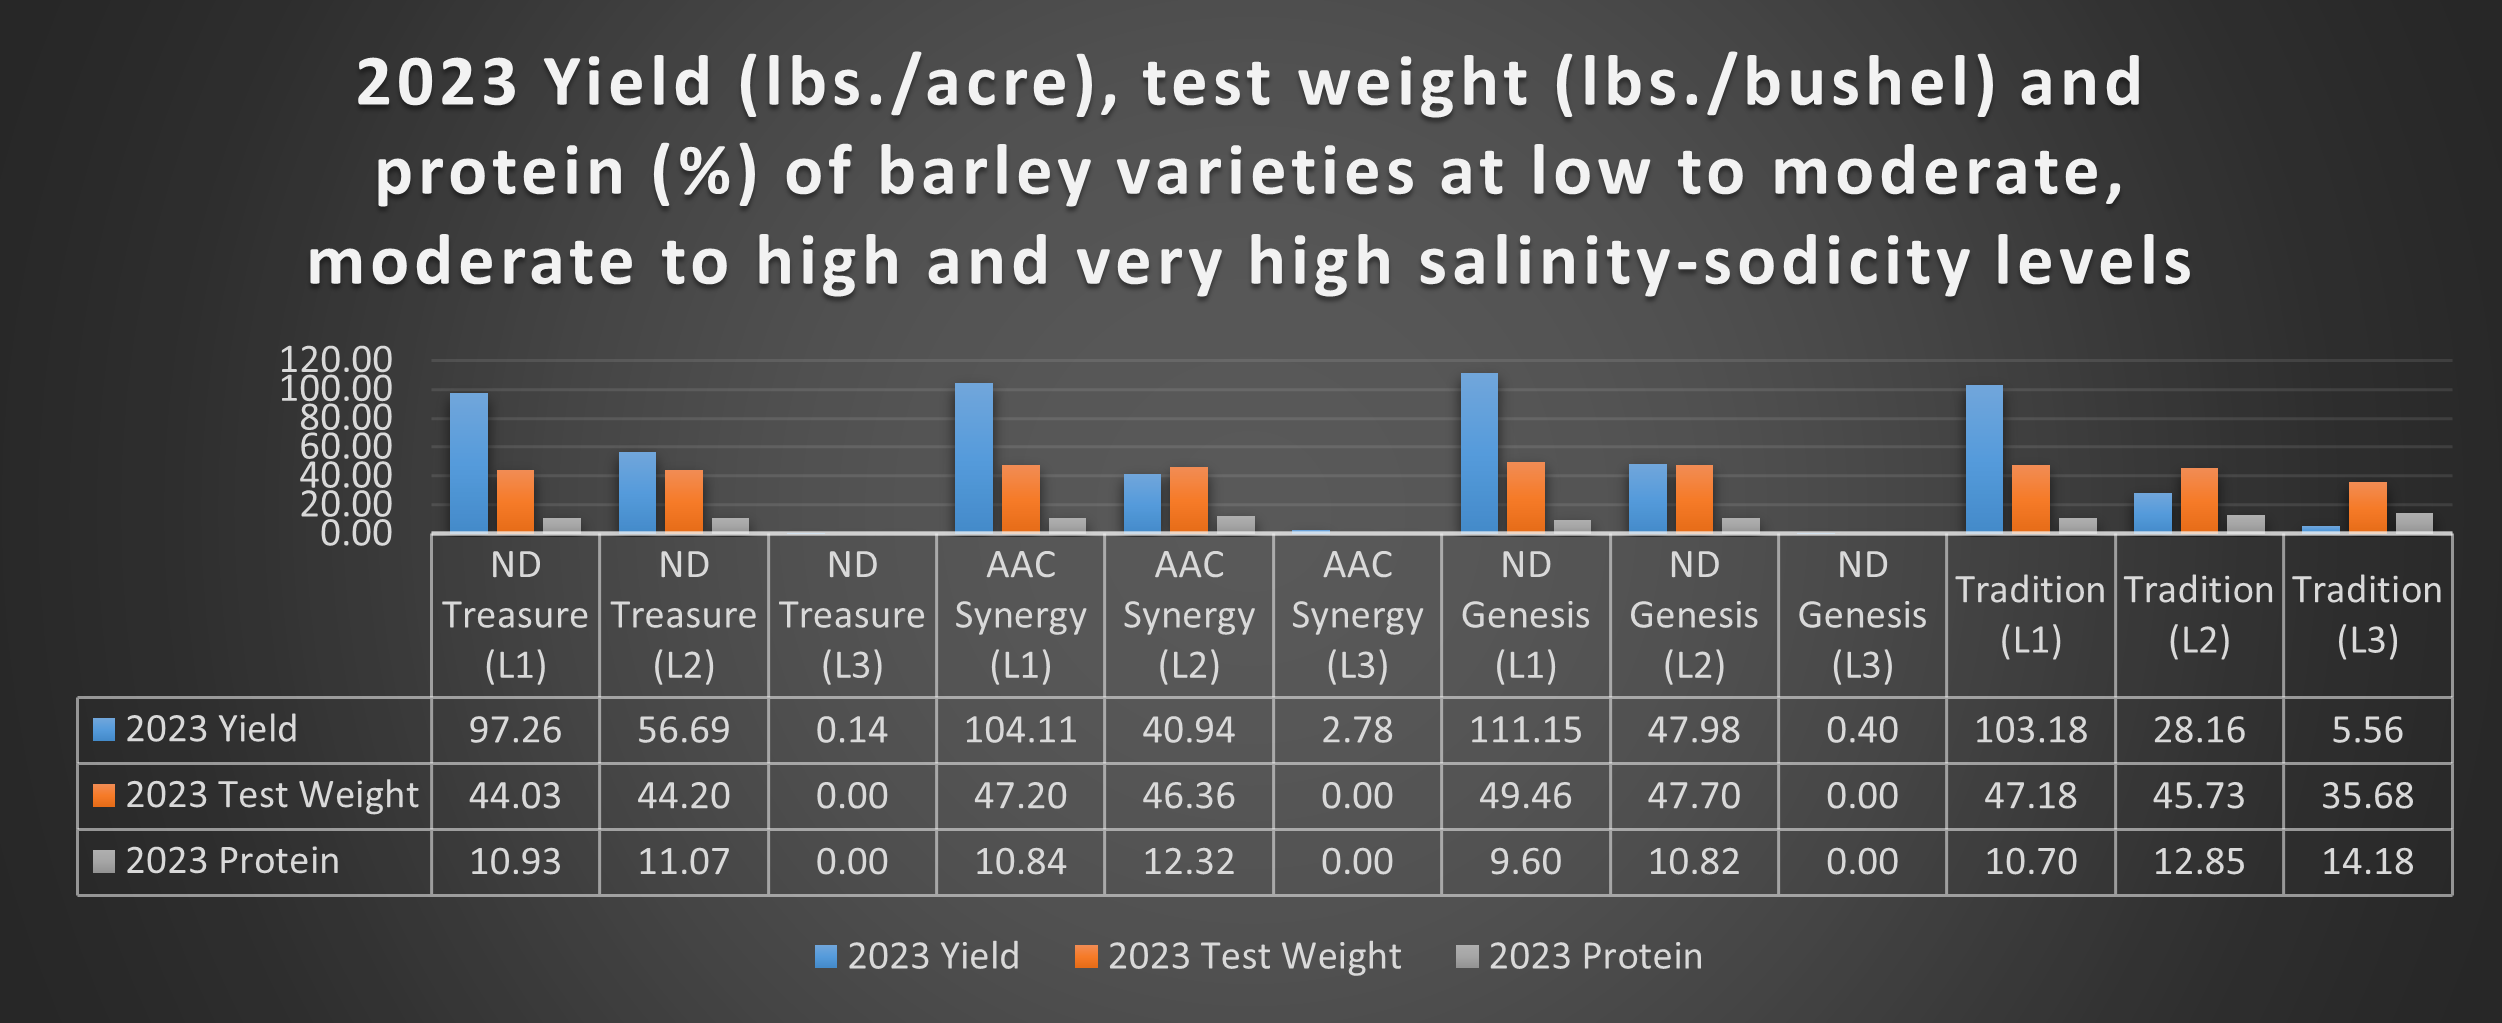
The 2023 barley varietal yields resembled 2020 yields, which showed a significant yield drop in level 2 and almost 100% loss in level 3 compared to level 1. This was a sharp contrast compared to 2022 and the main difference was the availability of soil moisture. All four varieties yielded high in level 1. There was an average decrease of 62.12% in yield for all varieties in level 2 compared to level 1. Tradition and AAC Synergy were the only varieties to produce over a bushel (5.56 and 2.78 bushels per acre respectively) in level 3.
Protein content increased in all barley varieties with the decrease in yield due to increase in salinity and sodicity. Test weight mostly decreased when salinity and sodicity levels increased. Details are in Figure 1.
Figure 1. 2023 yield, test weight and protein of four barley varieties.
Oats
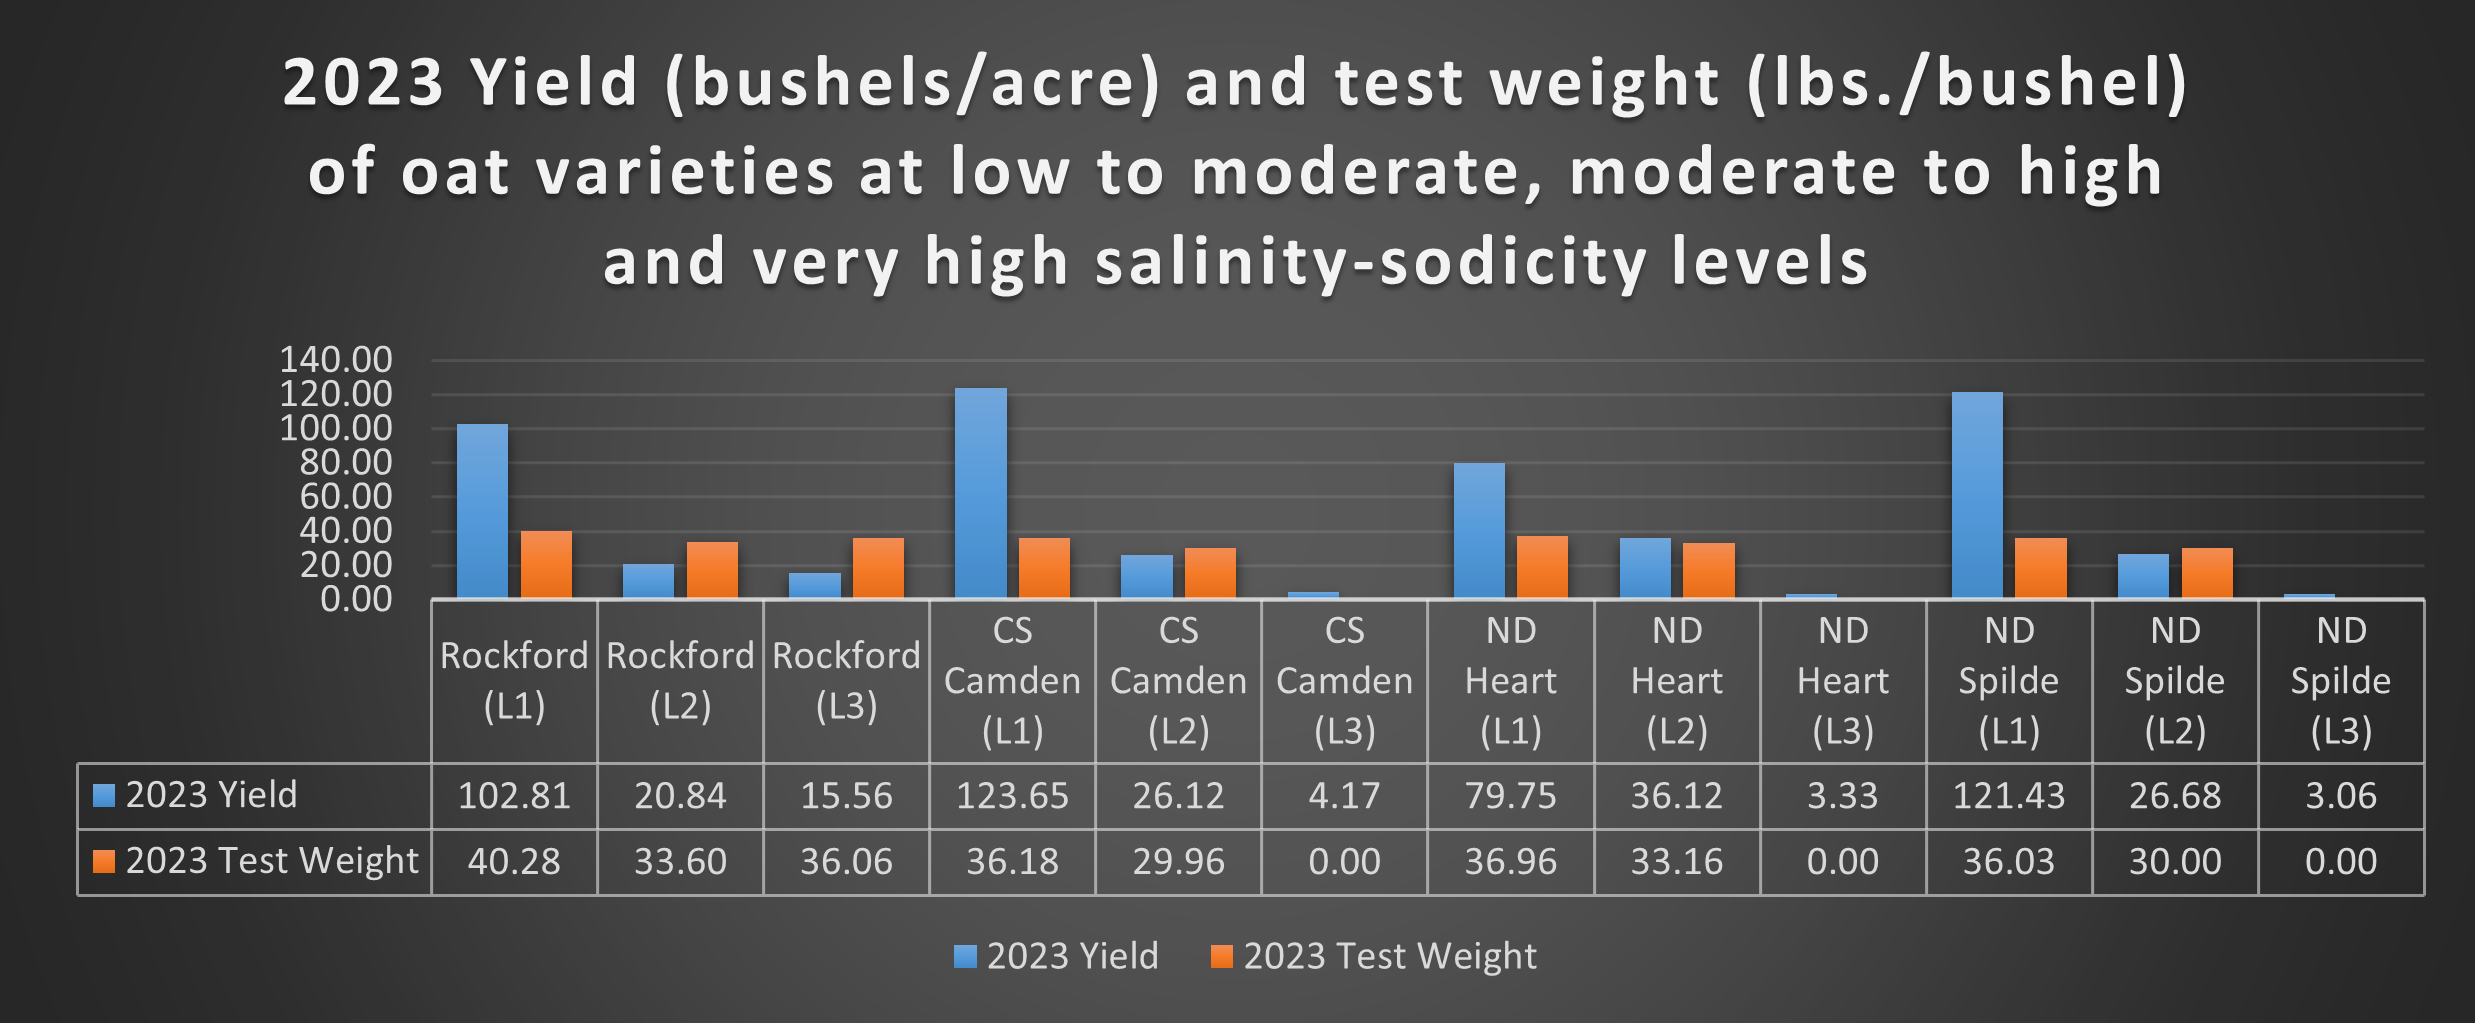
All varieties, except ND Heart, yielded over 100 bushels per acre in level 1. In level 2, average yield decrease for all varieties was 72.82% compared to level 1. Average yield decrease in level 3 was 93.69% versus level 1. Test weights were generally lower due to reduced growth and vigor at high salinity and sodicity levels. Details are in Figure 2.
Figure 2. 2023 yield and test weight of four oat varieties.
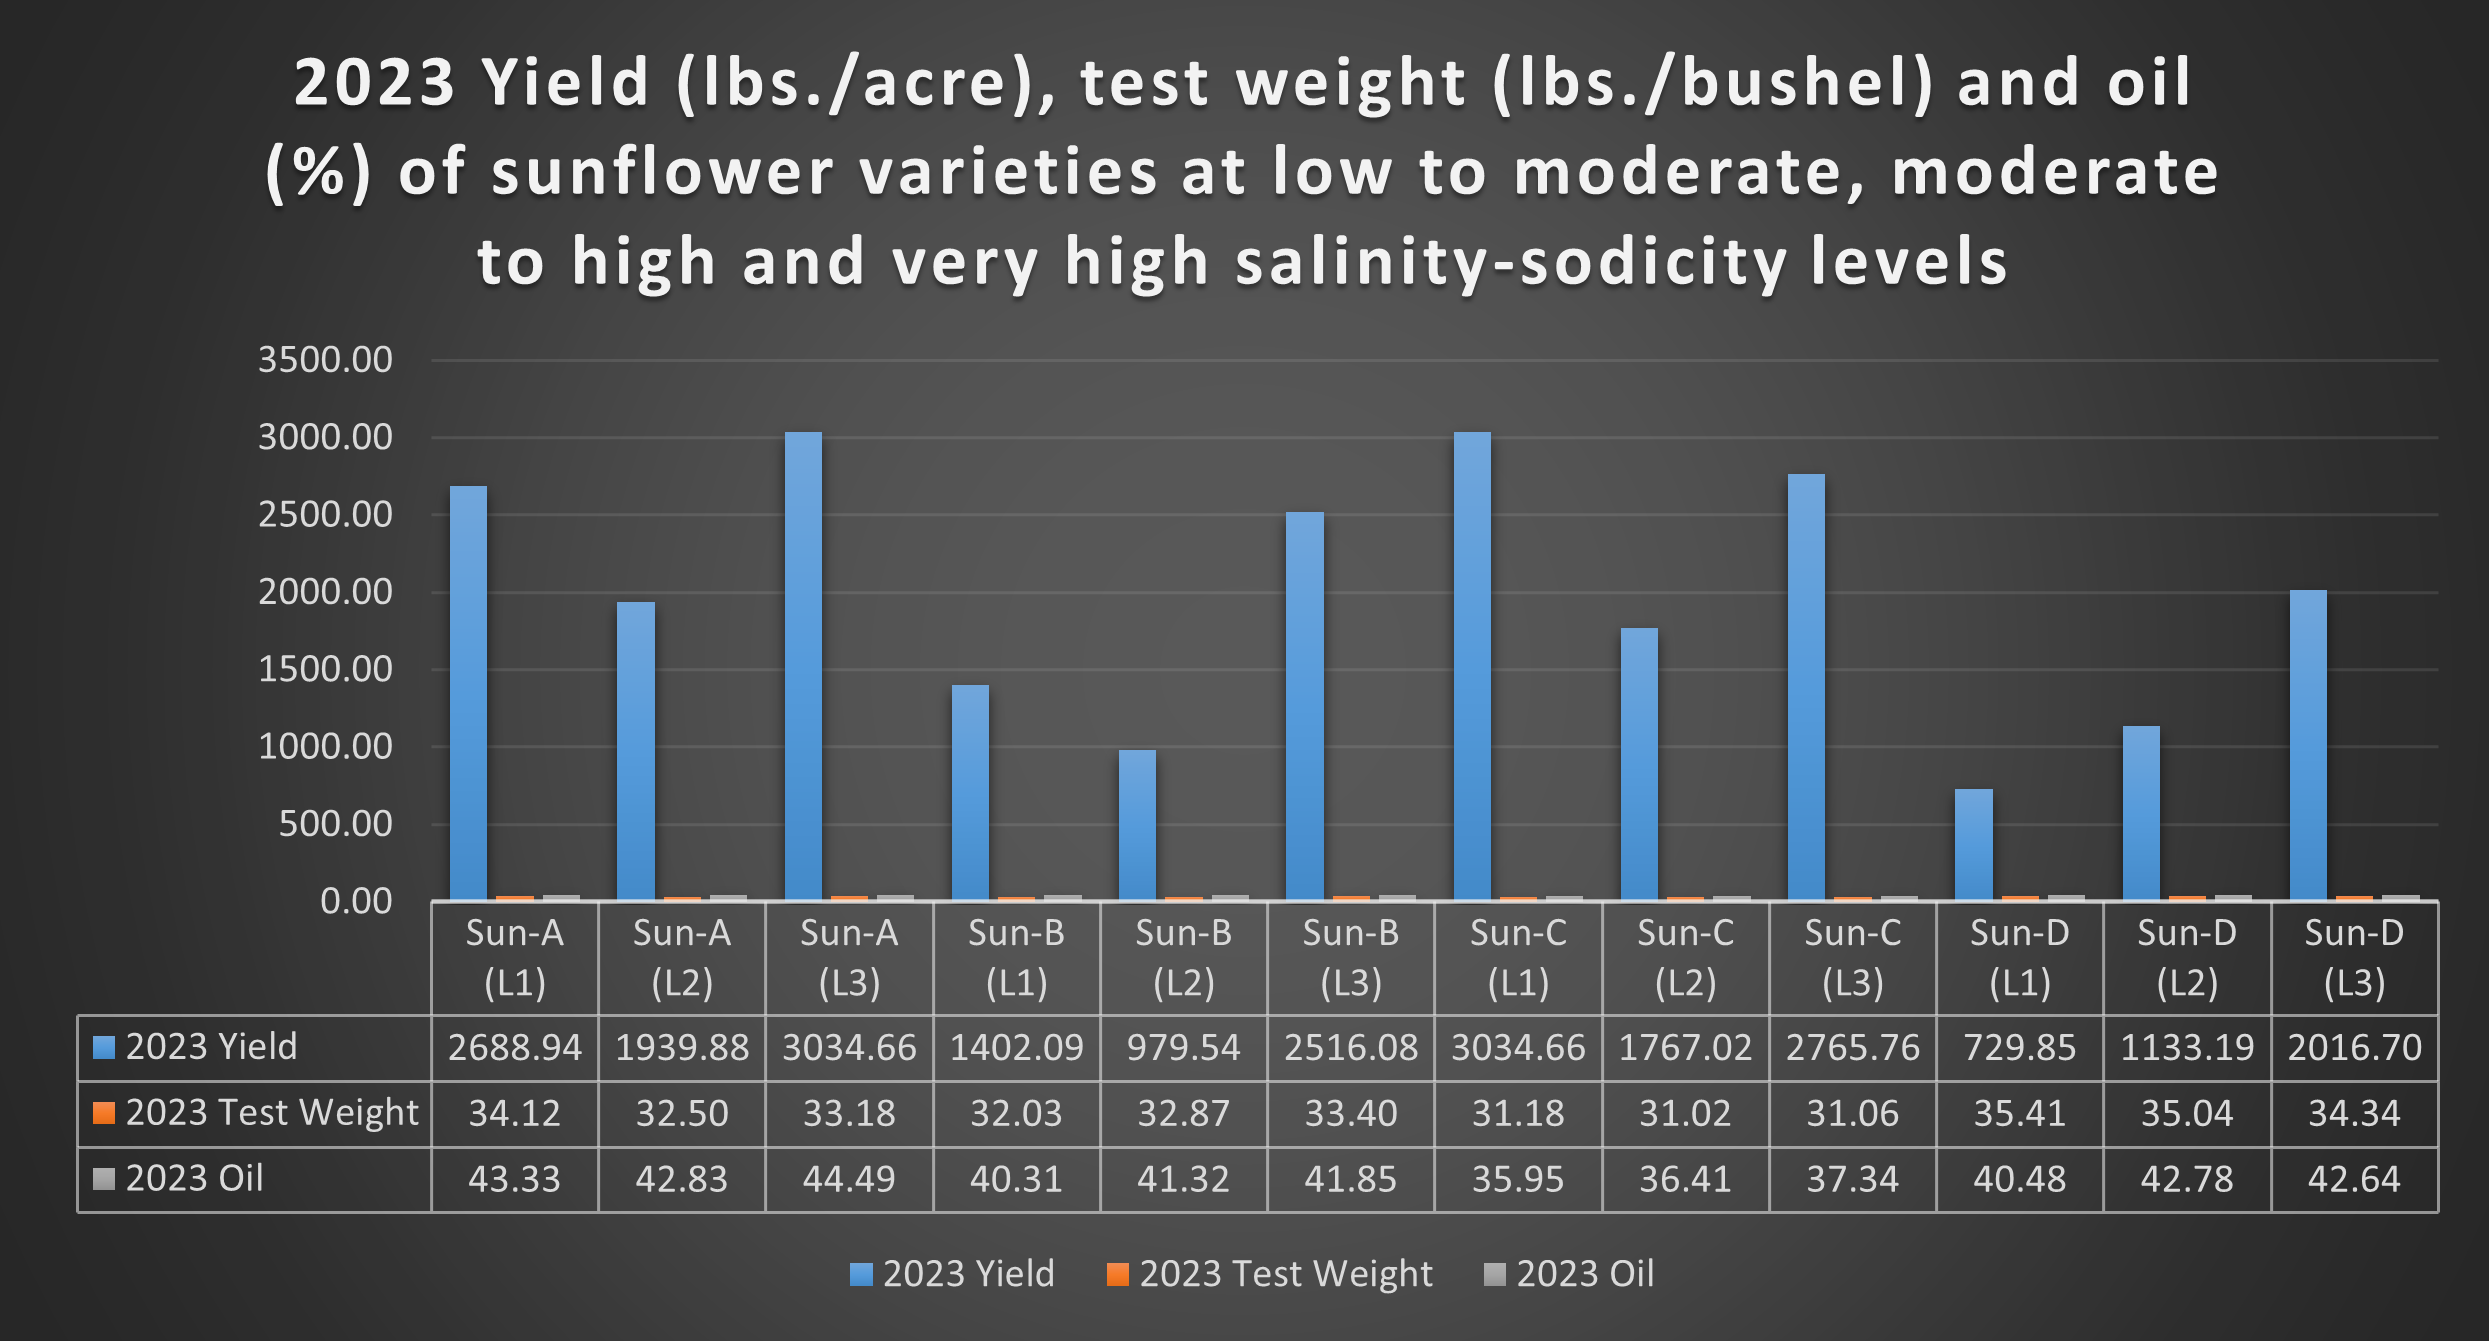
Sunflower
The sunflower varieties A, B and D produced the highest yields in level 3. Variety C yielded high as well in level 3. The comparatively lower sunflower yields in level 1 can be attributed to the damage caused by deer. In level 2, varieties A, B and C average yield decrease was 33.25% compared to level 1. Variety D had a 35.58% increase in yield. Overall, excluding deer damage, there was not much yield difference between levels 1 and 3. The oil % of the sunflower varieties remained quite comparable in all levels. Details are in Figure 3.
Figure 3. 2023 yield, test weight and oil of four sunflower varieties.