Title

Soil, Water and Plant Characteristics Important to Irrigation

(AE1675, Revised March 2022)
File
Publication File:
Summary

Includes explanations of all the parameters that might affect irrigation management. It is meant to be a resource where irrigators can look up topics important for irrigation.

Lead Author
Lead Author:
Revised by Thomas F. Scherer, Extension Agricultural Engineer
Other Authors

David Franzen, Extension Soil Science Specialist; Larry Cihacek, Associate Professor, Department of Natural Resource Sciences

Availability
Availability:
Available in print from the NDSU Distribution Center.

Contact your county NDSU Extension office to request a printed copy.
NDSU staff can order copies online (login required).

Publication Sections

Introduction

Irrigation is the application of water to ensure sufficient soil moisture is available for good plant growth throughout the growing season. Irrigation, as practiced in North Dakota, is called "supplemental irrigation" because it augments the rainfall that occurs prior to and during the growing season.

Irrigation often is used on full-season agronomic or high-value specialty crops to provide a dependable yield every year. It also is used on crops such as potatoes, flowers, vegetables and fruits where water stress affects the quality of the yield.

Most years, some places in the state receive sufficient rainfall for good plant growth. But in many of those years, other areas of the state experience reduced yields and/or reduced quality on nonirrigated crops due to water stress from insufficient soil moisture.

For irrigation planning purposes, the average precipitation during the growing season is not a good yardstick to determine a need for irrigation. The timing and amounts of rainfall during the season, the soil's ability to hold water and the crop's water requirements are all factors that influence the need for irrigation. Any location in the state can have what might be considered "wet or dry" weeks, months and even years.

Under irrigation, soil and water compatibility is very important. If they are not compatible, the applied irrigation water could have an adverse effect on the chemical and physical properties of the soil. Determining the suitability of land for irrigation requires a thorough evaluation of the soil properties, the topography of the land in the field and the quality of water to be used for irrigation. A basic understanding of soil/water/plant interactions will help irrigators efficiently manage their crops, soils irrigation systems and water supplies.

Soil Properties

The county soil survey contains detailed soils information for any parcel of land in North Dakota. Soil surveys of every county in North Dakota have been completed by the Natural Resources Conservation Service (NRCS). The official and most current of soil survey information is accessible on the NRCS’s Web Soil Survey website

Published copies can be found at local NRCS and NDSU Extension offices, but they may not have the latest soil survey information. The soil survey database provides information on important soil properties such as texture, structure, depth, permeability and chemistry, all of which are important for irrigation management.

Soil Texture

Soil texture is determined by the size and type of solid particles that make up the soil. Soil particles may be mineral or organic. Most irrigated soils in North Dakota are mineral soils.

For mineral soils, the texture classification is based on the relative proportion of the particles less than 2 millimeters (mm) or 5/64th of an inch in size. As shown in Figure 1, the largest particles are sand, the smallest are clay, and silt is in between. The soil texture is based on the percentage of sand, silt and clay (Figure 2).

diagram showing soil classification by the size of soil particles
Figure 1. Classification by size of the primary soil particles that define a textural group based on the U.S. Department of Agriculture soil classification system. Under SAND, V.F. refers to very fine and V.C. to very coarse.
USDA soil textural triangle
Figure 2. U.S. Department of Agriculture (USDA) soil textural triangle. The percent (by weight) of the sand, silt and clay fraction determines the texture of the soil. The dotted line depicts a loam soil that has 45% sand, 35% silt and 20% clay content.

Soil texture classes may be modified if greater than 15% of the particles are organic (for example, mucky silt loam). Soil particles greater than 2 mm are not used to determine soil texture. However, when they make up greater than 15% of the soil volume, the textural class is modified (for example, gravelly sand).

Separating and weighing the amount of sand, silt and clay in a sample determines the texture of a mineral soil. For example, if a 100-pound sample of soil were sifted through screens and found to contain 45 pounds of sand, 35 pounds of silt and 20 pounds of clay, then the soil would be composed of 45% sand, 35% silt and 20% clay. As shown by the dotted lines in Figure 2, this soil has a loam texture.

Twelve basic soil textures are shown on Figure 2. Sand, loamy sands and sandy loams are the most common soil textures irrigated in North Dakota.

Soil Structure

Soil structure refers to the grouping of particles of sand, silt and clay into larger aggregates of various sizes and shapes. The processes of root penetration, wetting and drying cycles, freezing and thawing, and animal activity, combined with inorganic and organic cementing agents, produce soil structure (Figure 3). Structural aggregates that are resistant to physical stress are important to the maintenance of soil tilth and productivity. Excessive cultivation or tillage of wet soils disrupt aggregates and accelerate the loss of organic matter, thus causing decreased aggregate stability.

illustration of most common soil structures
Figure 3. Examples of the most common soil structures. Also shown is the structures’ effect on downward movement (infiltration) of water. (Courtesy of the NRCS, Section 15 of the National Engineering Handbook)

The movement of air, water and plant roots through a soil is affected by soil structure. Stable aggregates result in a network of soil pores that allow rapid exchange of air and water with plant roots. Plant growth depends on rapid rates of exchange.

Practicing beneficial soil management techniques such as using cover crops, reduced tillage, crop rotations, organic matter additions and timely tillage practices can maintain good soil structure. In sandy soils, aggregate stability is often difficult to maintain due to low organic matter, clay content and resistance of sand particles to aggregation processes.

Soil Series

Soil is the layer of the Earth's surface that has been changed by physical or biological processes. The five soil-forming factors that control the process of change are parent material, climate, topography, biota (plants and animals) and time.

Soils are grouped into categories according to their observed properties. The U.S. Department of Agriculture’s classification system consists of six categories. The highest category (soil order) contains 11 basic soil groups, each with a very broad range of properties. The lowest category (soil series) contains more than 12,000 soils, each defining a very narrow range of soil properties.

North Dakota has 339 named soil series. A soil series is unique due to a combination of properties such as texture, structure, topographic position (on the side of a hill or in a valley) or depth to the water table.

A particular soil series describes areas in which these soil conditions are similar. These locations may be in the same field, section, county, state or even region. Soil delineations on county soil survey maps are based on the soil series.

A soil series generally is named after a town near the site that represents the typical properties for that soil. For example, the site with typical properties for the Embden soil series is near Embden, N.D.

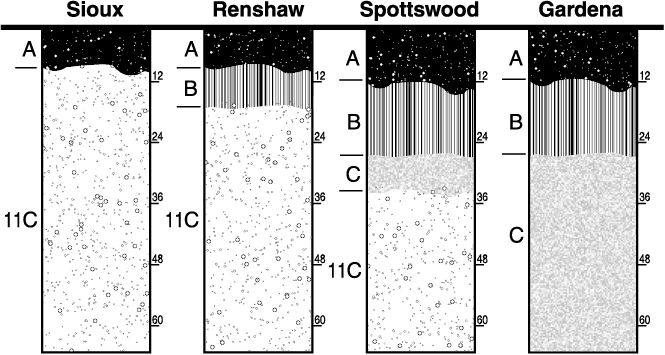
Many soil series do not have a deep, uniform soil profile. Restrictive subsurface layers often interfere with root penetration. In these soils, plant roots will be concentrated in the upper part of the soil profile. For example, in the Renshaw loam profile (Figure 4), the majority of the plant roots will be in the top 18 inches because the gravel below is a poor rooting environment. This type of information is important for irrigation management.

diagram of soil horizon depths for four soils
Figure 4. Soil horizon depths for four representative North Dakota soil series. A, B and C refer to the different soil horizons and IIC indicates a different parent material (for these soil series, it is sand and gravel).


Soil Depth

Soil depth refers to the thickness of the soil materials that provide structural support, nutrients and water for plants. In North Dakota, soil series that have bedrock 10 to20 inches below the surface are described as shallow. Bedrock from 20 to 40 inches is described as moderately deep.

Most soil series in North Dakota have bedrock at depths greater than 40 inches and are described as deep. Depth to contrasting textures is given in the soil series descriptions of the soil survey reports.

The depth to a contrasting soil layer of sand and gravel (Figure 4) can affect irrigation management decisions. If the depth to this layer is less than 3 feet, the rooting depth and available soil water for plants is decreased. Soils with less available water for plants require more frequent irrigations.

Soil Permeability and Infiltration

A measure of the ability of air and water to move through soil is its permeability. It is influenced by the size, shape and continuity of the pore spaces, which in turn are dependent on the soil bulk density, structure and texture.

Most soil series are assigned to a single permeability class based on the most restrictive layer in the upper 5 feet of the soil profile (Table 1). However, soil series with contrasting textures in the soil profile are assigned to more than one permeability class. In most cases, soils with a slow, very slow, rapid or very rapid permeability classification are considered poor for irrigation.

Table 1. Soil permeability classes.

Table 1. Soil permeability classes.

Classification

Infiltration Rate
(inches/hour)

Very slow

less than 0.06

Slow

0.06 to 0.2

Moderately slow

0.2 to 0.6

Moderate

0.6 to 2.0

Moderately rapid

2.0 to 6.0

Rapid

6.0 to 20.0

Very rapid

greater than 20.0

Infiltration is the downward flow of water from the surface through the soil. The infiltration rate (sometimes called intake rate) of a soil is a measure of its ability to absorb an amount of rain or irrigation water during a given time period. It commonly is expressed in inches per hour. It is dependent on the permeability of the surface soil, moisture content of the soil and surface conditions such as roughness (tillage and plant residue), slope and plant cover.

Coarse-textured soils, such as sands and gravel, usually have high infiltration rates. The infiltration rate of medium- and fine-textured soils, such as loams, silts and clays, is lower than coarse-textured soils and is influenced by the stability of the soil aggregates.

Water and plant nutrient losses may be greater on coarse-textured soils. Thus, the timing and quantity of chemical and irrigation water applications is particularly critical on these soils.

Saline and Sodic Soils

Salt-affected soils are grouped according to their content of soluble salts and sodium (Table 2). Saline and sodic soils usually occur in areas where ground water moves upward from a shallow water table close to the soil surface. The water carries dissolved minerals (salts) that accumulate in the soil as the water is evaporated from the soil surface or transpired through the plants to the atmosphere. In general, these soils are not recommended for irrigation.


Table 2. Soil chemistry measurements used to classify saline, sodic and saline-sodic soils.
 

Electrical Conductivity* (mmhos/cm)

pH

Sodium Adsorption Ratio*
(SAR)

Saline soil

greater than 4

less than 8.5

less than 13

Sodic soil

less than 4

8.5 to 10

greater than 13

Saline-sodic soil

greater than 4

less than 8.5

greater than 13

*Measured from a saturated soil extract

Saline and sodic soils may be of natural or man-made origins. One of the man-made processes is related to irrigation. Under certain combinations of irrigation water quality and soils, salts and/or sodium may accumulate in the root zone and have an adverse effect on plant growth.

Under some conditions, sodium can be controlled in the upper part of the soil through the use of soluble calcium amendments. The replacement of sodium by calcium improves the structure of the soil. Calcium soil amendments can be helpful in situations where land with a majority of unaffected irrigable soils contains pockets (inclusions) of sodium-affected soils. Under irrigation, calcium soil amendments will help where surface crusting has become a problem. Special irrigation management practices may be required on these soils.

Leaching or controlling the water table elevation can manage salt concentrations. Leaching is accomplished by applying more water than the soil will hold in the root zone. Large rainfall events, applying additional irrigation water or both will carry some of the salts below the root zone.

Planting a deep-rooted crop, such as alfalfa, or installing subsurface drainage can accomplish water table control. Deep ditches and tiling are methods of subsurface drainage that have been used successfully in many parts of the world to control the level of the water table.

Soil salt and sodium contents need to be measured to determine precisely the severity of the problem. The salt content of the soil is estimated from an electrical conductivity measurement using one of the following: a soil water extract, soil water slurry or soil paste. The sodium content of the soil often is measured on a soil water extract and expressed as the ratio between the sodium and calcium plus magnesium; it is given the term sodium adsorption ratio (SAR).

Soil sampling the surface layer (top 6 inches) on a periodic basis (every three to five years) will track the change in accumulated salt or sodium. The SAR of the soil samples will indicate if a buildup of sodium has occurred.

Generally, soils with an SAR of 13 from the saturated extract will exhibit significant physical problems due to dispersal of clay particles. Usually a soil with an SAR of 6 or lower from the saturated extract will not have physical problems associated with dispersed clay. However, if periodic sampling indicates that the SAR is increasing, say from 6 to 9, then you may need to consider corrective action.

Topography of the Field

Topography, or the "lay of the land," has a large impact on whether a field can be irrigated. Relief is a component of topography that refers to the difference in height between the hills and depressions in the field. The topographic relief will affect the type of irrigation system to be used, the water conveyance system (ditches or pipes), drainage requirements and water erosion control practices.

The shape and arrangement of topographic landforms and the type of surface waterway network also will influence irrigation management. For example, a low spot in the field where water typically accumulates after a rain may become a place that is continually wet with the addition of irrigation water.

With some crops, such as potatoes, a wet low spot could become a source of disease. For a center pivot, a tower that travels through the low spot could become stuck.

Slope

Slope is important to soil formation and management because of its influence on runoff, soil drainage, erosion, the use of machinery and choice of crops. Slope is the incline or gradient of a surface and commonly is expressed in percents.

The percent of slope is determined by measuring the difference in vertical elevation in feet over 100 feet of horizontal distance. For example, a 5% slope rises or falls 5 feet per 100 feet of horizontal distance.

The shape of the slope is another important characteristic. A convex slope curves outward like the outside surface of a ball, a concave slope curves inward like the inside surface of a saucer, and a plane slope is like a tilted flat surface.

Slopes are described as simple or complex. Simple slopes have a smooth appearance, with surfaces extending in one or perhaps two directions. For example, slopes on alluvial fans and foot slopes of river valleys are regarded as simple. Complex areas have short slopes that extend in several directions and consist of convex and concave slopes much like the knoll and pothole topography found on glacial till plains.

Gravity (surface) irrigation can be used only on simple slopes of 2% or less. In general, simple and complex slopes greater than 1% should be irrigated only with sprinkler or drip systems. Center pivot sprinkler irrigation systems can operate on slopes up to 15%, but generally simple slopes greater than 9% are not recommended.

To accommodate gravity or sprinkler irrigation systems, land smoothing can be used to modify the slope in a field. However, land smoothing may cause yield reductions for one to three growing seasons. The places where topsoil was removed are most likely to have yield reductions. Special management using increased organic matter may be required to accelerate soil building in these areas.

Irrigation Water Quality

The quality of some water sources is not suitable for irrigating crops. Irrigation water must be compatible with the crops and soils to which it will be applied. The Soil and Water Testing Laboratory in the Soil Science Department at NDSU provides soil and water compatibility recommendations for irrigation. A water analysis and legal description of the land proposed for irrigation are required before a recommendation can be made.

The quality of water for irrigation purposes is determined by its total dissolved salt content. An analysis of water for irrigation should include the cations (calcium, magnesium and sodium) and the anions (bicarbonate, carbonate, sulfate and chloride). Because some crops are sensitive to boron, it often is included in the analysis.

Irrigation Water Classification

The two most important factors to look for in an irrigation water quality analysis are the total dissolved solids (TDS) and the sodium adsorption ratio (SAR). The TDS of a water sample is a measure of the concentration of soluble salts in a water sample and commonly is referred to as the salinity of the water.

The electrical conductivity (EC) of a water sample often is used as a proxy for TDS. EC can be expressed in many different units, and this often causes confusion. On an irrigation water test report, you might see one of the following units::

  • millimhos per centimeter (mmhos/cm)
  • micromhos per centimeter (μmhos/cm)
  • deci-Siemens per meter (dS/m)
  • micro-Siemens per centimeter (μS/cm)

where:

1,000 μmhos/cm = 1 mmho/cm = 1 dS/m = 1,000 μS/cm

The SAR of a water sample is the proportion of sodium relative to calcium and magnesium. Because it is a ratio, the SAR has no units.

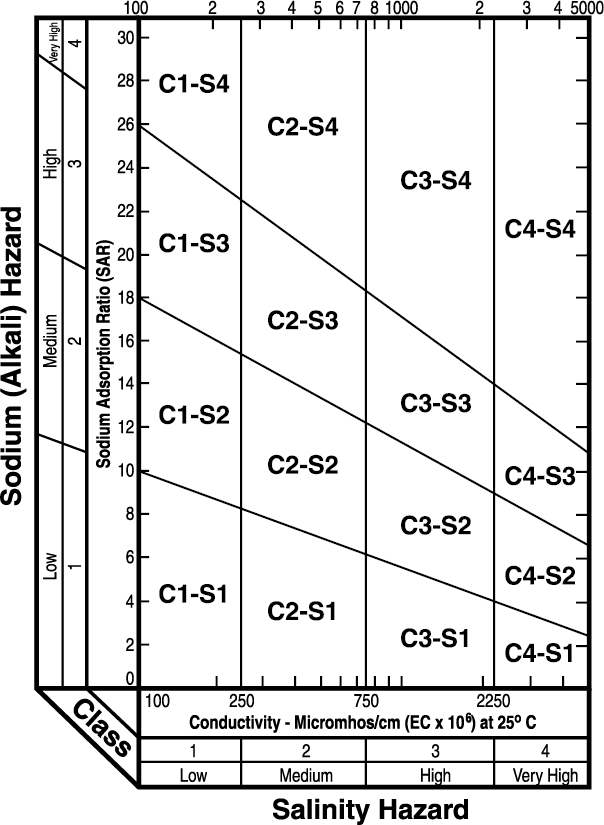
Laboratories that perform irrigation water analysis may provide a suitability classification based on a system developed at the U.S. Salinity Laboratory in California (Figure 5). This classification system combines salinity and sodicity. For example, a water sample classified as C3-S2 would have a high salinity rating and a medium SAR rating.

diagram showing the classification of irrigation water
Figure 5. Diagram showing the classification of irrigation water. (From Agriculture Handbook No. 60, USDA Salinity Laboratory in Riverside, Calif.)

The scale for sodicity is not constant because it depends on the level of salinity. For example, an SAR of 8 is in the S1 category if the salinity is from 100 to 300 μmhos/cm; S2 if the salinity is from 300 to 3,000 μmhos/cm and S3 if the salinity is greater than 3,000 μmhos/cm.

Much of the water in North Dakota is classified in the C2 to C3 salinity range and the S1 to S2 sodium hazard range. In general, any water with an EC greater than 2,000 or an SAR value greater than 6 is not recommended for continuous irrigation in North Dakota.

In cases where sporadic irrigation is practiced ( a particular piece of land is irrigated one year out of three or more), lower-quality water may be used. However, the lower-quality water should not have an EC that exceeds 3,000 μmhos/cm or an SAR greater than 10.

Calcium added to irrigation water can lower the SAR and reduce the harmful effects of sodium. The effectiveness of added calcium depends on its solubility in the irrigation water. Calcium solubility is controlled by the source of the calcium (for example, calcium carbonate, gypsum, calcium chloride) and the concentration of other ions in the irrigation water.

Compared with calcium carbonate and gypsum, calcium chloride additions will result in higher concentrations of soluble calcium and be the most effective at lowering irrigation water SAR. However, calcium chloride is considerably more expensive than calcium carbonate and calcium sulfate (gypsum).

Salinity

  • C1 - Low-salinity water: Can be used for irrigation with most crops on most soils with little likelihood that soil salinity will develop. Some leaching is required, but this occurs under normal irrigation practices except in soils of slow and very slow permeability.
  • C2 - Medium-salinity water: Can be used if a moderate amount of leaching occurs. Plants with moderate salt tolerance can be grown in most cases without special practices for salinity control.
  • C3 - High-salinity water: Cannot be used on soils with moderately slow to very slow permeability. Even with adequate permeability, special management for salinity control may be required and plants with good salt tolerance should be selected.
  • C4 - Very high salinity water: Is not suitable for irrigation under ordinary conditions but may be used occasionally under very special circumstances. The soils must have rapid permeability, drainage must be adequate, irrigation water must be applied in excess to provide considerable leaching, and very salt-tolerant crops should be selected.

Sodium

  • S1 - Low-sodium water: Can be used for irrigation on almost all soils with little danger of the development of harmful levels of exchangeable sodium.
  • S2 - Medium-sodium water: Will present an appreciable sodium hazard in fine-textured soils, especially under low leaching conditions. This water may be used on coarse-textured soils with moderately rapid to very rapid permeability.
  • S3 - High-sodium water: Will produce harmful levels of exchangeable sodium in most soils and requires special soil management, good drainage, high leaching and high organic matter additions.
  • S4 - Very high sodium water: Generally is unsatisfactory for irrigation purposes except at low and perhaps medium salinity.

Carbonates

Carbonate and bicarbonate ions in the water combine with calcium and magnesium to form compounds that precipitate out of solution. The removal of calcium and magnesium increases the sodium hazard to the soil due to the irrigation water. The increased sodium hazard often is expressed as "adjusted SAR." The increase of "adjusted SAR" from the SAR is a relative indication of the increase in sodium hazard due to the presence of these ions.

Nozzles of sprinkler systems have been plugged by carbonate minerals in some states but this has not been observed in North Dakota. However, carbonate minerals have plugged the emitters in drip irrigation systems in North Dakota. To control this problem, add a mild acid to lower the pH of the irrigation water.

Boron

Boron is essential for the normal growth of all plants, and the quantity required is low compared with other minerals. However, some plants are sensitive to even low boron concentrations. Dry beans are very sensitive to small amounts of boron, but corn, potatoes and alfalfa are more tolerant. In fact, the concentration of boron that will injure the sensitive plants often is close to that required for normal growth of tolerant plants.

Although no problems with boron in water used for irrigation in North Dakota have been documented, testing for this element in irrigation water is a precautionary practice. Boron does occur in some North Dakota ground water at concentrations that are theoretically toxic to some crops.

A boron concentration greater than 2 parts per million (ppm) may be a problem for certain sensitive crops, especially in years that require large quantities of irrigation water.

The Interaction Between Soil and Water

Soil is a medium that stores and moves water. If a cubic foot of a typical silt loam topsoil were separated into its component parts, about 45% of the volume would be mineral matter (soil particles), organic residue would occupy about 5% of the volume and the rest would be pore space.

The pore space is the voids between soil particles and is occupied by air or water. The quantity and size of the pore spaces are determined by the soil's texture, bulk density and structure.

Water is held in soil in two ways: as a thin coating on the outside of soil particles and in the pore spaces. Soil water in the pore spaces can be divided into two different forms: gravitational water and capillary water (Figure 6).

illustrations of gravitational water where excess drains downward and capillary water where it is retained
Figure 6. The two primary ways that water is held in the soil for plants to use are capillary and gravitational forces.
1. Gravitational water- he pore spaces are filled with water in excess of their capillary capacity, and the excess, or gravitational water, drains downward.

2. Capillary water is held in the pore space against the force of gravity.

Gravitational water generally moves quickly downward in the soil due to the force of gravity. Capillary water is the most important for crop production because it is held by soil particles against the force of gravity.

As water infiltrates into a soil, the pore spaces fill with water. As the pores are filled, water moves through the soil by gravity and capillary forces. Water movement continues downward until a balance is reached between the capillary forces and the force of gravity.

Water is pulled around soil particles and through small pore spaces in any direction by capillary forces. When capillary forces move water from a shallow water table upward, salts may precipitate and concentrate in the soil as water is removed by plants and evaporation..

Water Holding Capacity of Soils

The four important levels of soil moisture content reflect the availability of water in the soil. These levels commonly are referred to as 1) saturation, 2) field capacity, 3) wilting point and 4) oven dry.

When a soil is saturated, the soil pores are filled with water and nearly all of the air in the soil has been displaced by water. The water held in the soil between saturation and field capacity is gravitational water. Frequently, gravitational water will take a few days to drain through the soil profile and, thus, some can be absorbed by roots of plants.

Field capacity is defined as the level of soil moisture left in the soil after drainage of the gravitational water (Figure 7). Water held between field capacity and the wilting point is available for plant use.

illustration of soil moisture available to plants
Figure 7. Soil moisture available to plants is the amount held between field capacity and wilting point.
Left: Field capacity.- the capillary pores are full and the remaining pore space is filled with air.
Right: Wilting point. The water available to plants is exhausted.

The wilting point is defined as the soil moisture content at which most plants cannot exert enough force to remove water from small pores in the soil. Most crops will be damaged permanently if the soil moisture content is allowed to reach the wilting point. In many cases, yield reductions may occur long before this point is reached.

Capillary water held in the soil beyond the wilting point can be removed only by evaporation. When dried in an oven, nearly all water is removed from the soil. "Oven dry" moisture content is used to provide a reference for measuring the other three soil moisture contents.

When discussing the water-holding capacity associated with a particular soil series, the water available for plant use in the root zone commonly is given (Table 3). Available soil water content commonly is expressed as inches per foot of soil.

For example, the water available can be calculated for a soil with fine sandy loam in the first foot, loamy sand in the second foot and sand in the third foot. The top foot would have about 2 inches, the second foot would have about 1 inch and the third foot would have about 0.75 inch for a total of 3.75 inches of available water for a crop with a 3-foot root depth.

Table 3. Available soil moisture holding capacity for various soil textures.
Soil Texture inches/inch inches/foot

Coarse sand and gravel

0.02 to 0.06

0.2 to 0.7

Sands

0.04 to 0.09

0.5 to 1.1

Loamy sands

0.06 to 0.12

0.7 to 1.4

Sandy loams

0.11 to 0.15

1.3 to 1.8

Fine sandy loams

0.14 to 0.18

1.7 to 2.2

Loams and silt loams

0.17 to 0.23

2.0 to 2.8

Clay loams and silty clay loams

0.14 to 0.21

1.7 to 2.5

Silty clays and clays

0.13 to 0.18

1.6 to 2.2


Soil Moisture Tension

The degree to which water clings to the soil is the most important soil water characteristic to a growing plant. This concept often is expressed as soil moisture tension. Soil moisture tension is negative pressure and commonly expressed in units of bars.

During this discussion, when soil moisture tension becomes more negative, it will be referred to as "increasing" in value. Thus, as soil moisture tension increases (the soil water pressure becomes more negative), the amount of energy exerted by a plant to remove the water from the soil also must increase. One bar of soil moisture tension is nearly equivalent to -1 atmosphere of pressure (1 atmosphere of pressure is equal to 14.7 pounds per square inch at sea level).

A soil that is saturated has a soil moisture tension of about -0.001 bars or less, which requires little energy for a plant to pull water away from the soil. At field capacity, most soils have a soil moisture tension between -0.05 and -0.33 bars. Soils classified as sandy may have field capacity tensions around -0.10 bars, while clayey soil will have field capacity at a tension around -0.33 bars. At field capacity, removing water from the soil is relatively easy for a plant.

The wilting point is reached when the maximum energy exerted by a plant is equal to the tension with which the soil holds the water. For most agronomic crops, this is about -15 bars of soil moisture tension. To put this in perspective, the wilting point of some desert plants has been measured to be between -50 and -60 bars of soil moisture tension.

The presence of high amounts of soluble salts in the soil reduces the amount of water available to plants. As dissolved salts increase in soil water, the energy expended by a plant to extract water also must increase even though the soil moisture tension remains the same. In essence, dissolved salts decrease the total available water in the soil profile.

How Plants Get Water From Soil

Water is essential for plant growth. Without enough water, normal plant functions are disturbed, and the plant gradually wilts, stops growing and dies. Plants are most susceptible to damage from water deficiency during the vegetative and reproductive stages of growth. Also, many plants are very sensitive to salinity during germination and early growth stages.

Most of the water that enters the plant roots does not stay in the plant. Less than 1% of the water withdrawn by the plant actually is used in photosynthesis ( assimilated by the plant). The rest of the water moves to the leaf surfaces, where it transpires (evaporates) to the atmosphere. The rate at which a plant takes up water is controlled by its physical characteristics, the atmosphere and soil environment.

As water moves from the soil into the roots, through the stem, into the leaves and through the leaf stomata to the air, it moves from a low water tension to a high water tension (Figure 8). The water tension of the air is determined in large part by the relative humidity and always is greater than the water tension in the soil.

drawing showing water movement from the soil into the roots, up the stalk, into the leaves and out into the atmosphere.
Figure 8. Illustration of the energy differentials that drive the water movement from the soil into the roots, up the stalk, into the leaves and out into the atmosphere. The water moves from a less negative soil moisture tension to a more negative tension in the atmosphere.

Plants can extract only the soil water that is in contact with their roots. For most agronomic crops, the root distribution in a deep, uniform soil is concentrated near the soil surface (Figure 9). Thus, during the course of a growing season, plants generally extract more water from the upper part of their root zone than from the lower part.

Illustration showing plant water extraction throughout the growing season: 40% from the top quarter, 30% from the second, 20% from the third, and 10% from the bottom of the root zone.
Figure 9. During the course of a growing season, plants will extract about 40% of their water from the top quarter, 30% from the second quarter, 20% from the third quarter and 10% from the bottom quarter of the root zone.

Plants such as grasses, which have a high root density per unit soil volume, may be able to absorb all available soil water. Other plants, such as vegetables, which have a low root density, may not be able to obtain as much water from an equal volume of the same soil. Thus, vegetables are generally more sensitive to water stress than high-root-density agronomic crops such as alfalfa, corn, wheat and sunflower.

Crop Water Use

Crop water use, also called evapotranspiration or ET, often is given as a daily estimate of the combination of the amount of water transpired by plants and the amount of evaporation from the soil surface around the plants. A plant's water use changes with a predictable pattern from germination to maturity.

All agronomic crops have a similar water use pattern (Figure 10). However, total crop water use will vary from growing season to growing season due to changes in climatic variables (air temperature, amount of sunlight, humidity, wind), and soil differences among fields (root depth, soil water holding capacities, texture, structure, etc.).

graph showing during the reproduction part of the growing season uses the most water
Figure 10. Typical water use curve for most agronomic crops.

Many years of research have produced equations that allow accurate calculated estimates of crop water use values for the major irrigated crops in North Dakota using measured daily weather variables. These equations have been combined with the weather data collected by the North Dakota Agricultural Weather Network (NDAWN) to provide daily crop water use estimates for each weather station in the network. The crop water use values can be found in table or map format on the NDAWN website.

Knowledge of the water use patterns during the different growth stages has a major influence on how an irrigation system is designed and managed. Failure to recognize the water use patterns of a crop may result in poorly managed water applications. Crop water stress, fertilizer and pesticide leaching, and increased pumping costs are just a few of the results of poor irrigation water management.

Irrigation Water Management

One of the most difficult parts of irrigation water management is deciding when to turn on the irrigation system and how much to apply. Good irrigation management begins with the accurate measurement of the rain amount received on each irrigated field. Ideally, each irrigated field should have at least one and possibly two rain gauges (at least 2 inches in diameter) mounted on posts next to the field.

The estimation of soil moisture is the most common method of irrigation water management; however, it must be done on a regular basis throughout the growing season. During the heat of the summer, checking the soil moisture two to three times each week is common.

The oldest and most commonly used is the "feel method," which estimates soil moisture by taking a soil sample in hand and squeezing it into a ball. By observing the appearance of the ball and creating a ribbon of soil between the thumb and forefinger, an estimate of the soil moisture content can be determined. This method requires practice and experience to become accurate at predicting irrigation water needs.

To determine the complete soil water status, soil samples should be obtained from several levels in the root zone. This method is popular because it can be combined with other field activities, such as scouting for insects, soil sampling for nitrogen or petiole sampling.

Mechanical devices such as tensiometers and soil moisture blocks also are used for irrigation water management. These devices are particularly helpful with fruit and vegetable crops. For these crops, they have proven to be accurate, reliable and inexpensive. Other more sophisticated instrumentation can be used for irrigation scheduling but generally are not used for irrigation management due to the expense.

Irrigation Scheduling

Irrigation scheduling is the science and/or art of applying the proper amount of water at the proper time to provide the maximum useable soil moisture in a plant’s root zone without causing harmful stress. Irrigation scheduling is a balancing act between applying too much water or not enough to meet plant needs at a particular stage of growth.

Applying too much water can lead to higher pumping costs and more disease pressure on the crop. Applying too little water at the wrong time will cause crop stress and reduced yields. The practice of irrigation scheduling is basically a decision methodology. Each irrigator has had to learn to develop an irrigation scheduling method that works in his or her situation.

A common form of irrigation scheduling is the “replacement” method. Irrigators who follow this method record (usually on a calendar) rain and irrigation amounts and daily crop water use. Irrigation timing and amount are adjusted to replace the soil water used by the crop.

Another form of the replacement method is to assume the average daily crop water use is 0.25 inch per day. The average total for a week in July and August is 1.75 inches. Rain amounts during the week are subtracted from 1.75 and that amount of irrigation water is applied. With access to the Internet, this method could be improved significantly by using the crop water use amounts from the NDAWN website.

An irrigation scheduling procedure called the "checkbook" method has been used successfully for many years in North Dakota. The checkbook method is a soil moisture accounting method that uses daily crop water use values and soil water-holding capacities to predict the time and amount of water needed to replenish what has been removed from the root zone. Rain and irrigation amounts are “deposits” for storage in the root zone, and crop water use is a withdrawal of water from that storage.

Irrigation-scheduling tools are available to irrigators in North Dakota.

  • NDSU Extension publication AE79  Irrigation Scheduling by the Checkbook Method is a manual method.
  • Crop water use tables are available from the North Dakota Agricultural Weather Network (NDAWN) for 10 irrigated crops in North Dakota. During the growing season, this application calculates the estimated daily crop water use for each crop at each station on the NDAWN system using the weather data collected from that station. The estimates are updated automatically each day during the growing season. This makes the crop water use estimates site-specific to the geographic area where the station is located.
  • A spreadsheet version of AE792 also has been developed. It includes the checkbook methods from NDSU and the University of Minnesota. For North Dakota, the program can be used to schedule irrigation on corn, wheat, barley, potato, alfalfa, soybean, sunflowers, sugar beets and sunflowers. For Minnesota, the program can be used to schedule irrigation on corn, wheat, soybean, sunflower, potato, sugar beets and dry bean. Get the Irrigation Scheduling - checkbook method.  

This publication was authored by Thomas F. Scherer, Extension agricultural engineer; Bruce Seelig, former Extension water quality specialist; and David Franzen, Extension soil science specialist, NDSU, 1996.